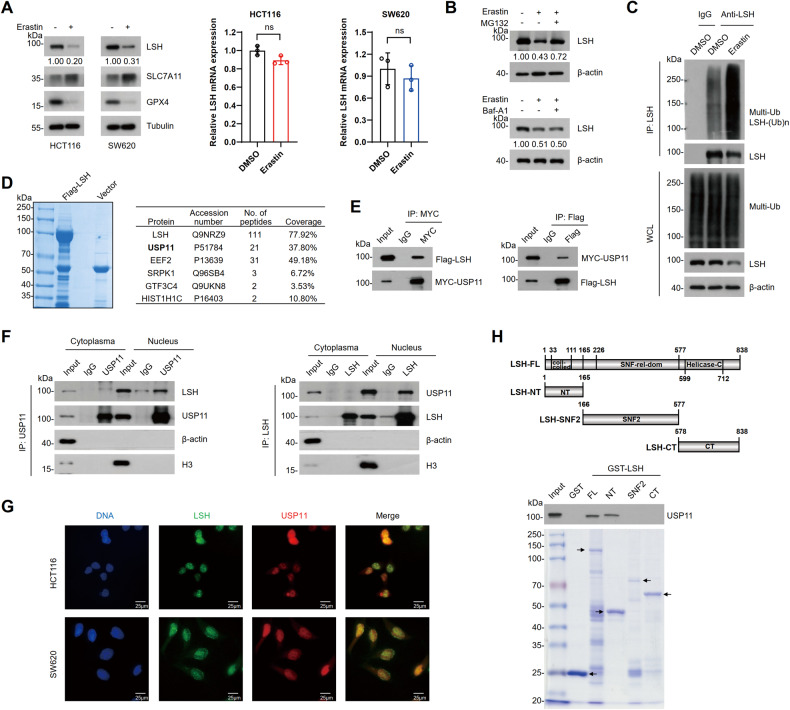
Fig. 2. LSH is degraded upon erastin treatment and interacts with USP11.
A Protein and mRNA expression of LSH were analyzed by WB (left) or RT-qPCR (right) in HCT116 and SW620 cells that treated with erastin (20 μM) for 24 h. Values are presented as mean ± SD (n = 3). B WB analysis of HCT116 cells that were treated with erastin (20 µM) for 16 h, then were incubated with MG132 (20 μM) for 6 h or Baf-A1 (1 µM) for 16 h. C HCT116 cells incubated with DMSO or erastin (20 µM) for 24 h were subjected to Co-IP with control IgG or LSH antibodies. Ubiquitination of LSH was analyzed by WB. D Liquid chromatography-tandem mass spectrometry analysis of Flag-LSH immunoprecipitated proteins from HCT116 cells (left). Representative peptide fragment counts and peptide coverage of indicated proteins are shown (right). E Co-IP analysis of the interaction between Flag-LSH and MYC-USP11 in HEK293T cells. MYC-IP (left); Flag-IP (right). F Cytoplasmic and nuclear extracts from HCT116 cells were fractionated for Co-IP using USP11 or LSH antibody. USP11-IP (left); LSH-IP (right). G Immunofluorescence analysis of USP11 and LSH in HCT116 and SW620 cells. Scale bar, 25 μm. H Mapping of the region in LSH that interacts with USP11. A schematic diagram of the constructed LSH truncations (top) and purified proteins with Coomassie blue staining (bottom) are shown.

