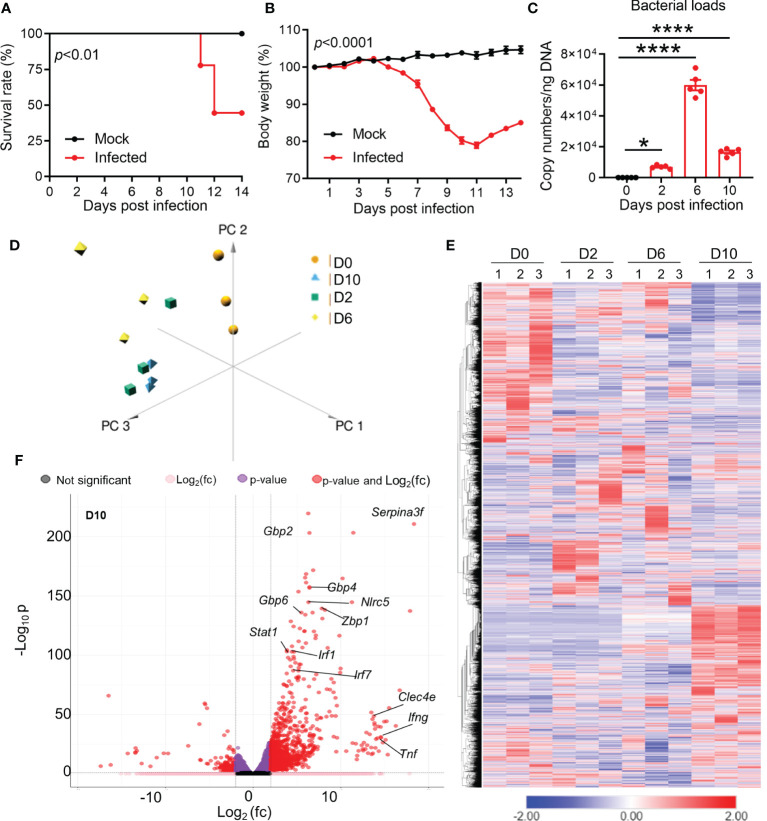
Figure 1.
Dynamic brain transcriptomes of mice following Ot infection. B6 mice (5/group) were injected i.v. with Ot (6 × 10⁴ FFU) or PBS (used as a mock or D0 controls). Brain cortexes were harvested at days 2, 6, and 10 post-infections, followed by RNA isolation. (A) Animal survival rates. (B) Body weight changes. (C) Bacterial burdens in the brain tissues. This animal experiment has been conducted independently three times and the data are shown from a single representative experiment. ****, p < 0.0001. (D) Principal component analysis of RNA-seq data of mouse brain at days 2, 6, and 10. Three samples in each group were performed for RNA-seq analysis. (E) Unsupervised clustering of brain transcriptomes. (F) Volcano plot analysis of differentially expressed genes at day 10 vs day 0.

