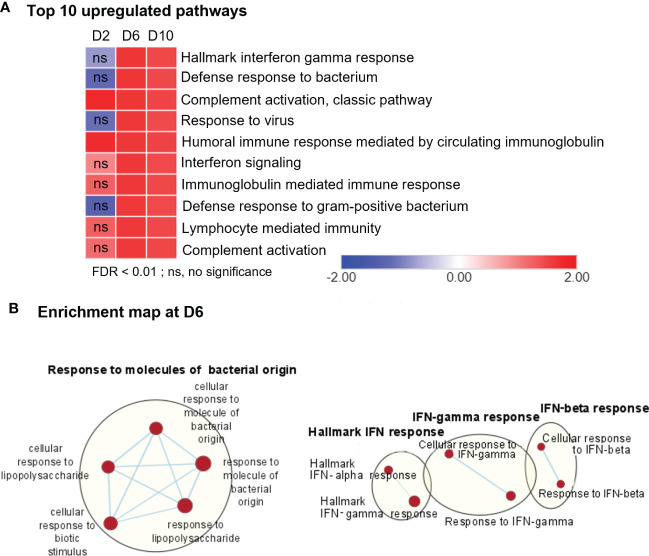
Figure 2.
RNA-seq analyses of differentially expressed genes, showing upregulation in immune signaling in Ot-infected mouse brains. Brain RNA-seq experiment was performed, as in Figure 1 . (A) Pathway enrichment analysis of differential expressed genes by using GSEA shows top 10 upregulated pathways in infected brain samples as compared to mocks. (B) Cytoscape enrichment map (FDR Q value < 0.01) of GSEA pathways enriched in upregulated genes in infected mouse brain at day 6 compared to mocks. Clusters of nodes were labeled using Auto Annotate feature of Cytoscape application. Red nodes represent upregulated gene set enrichment, while blue represents downregulated gene sets. ns, not significant.

