Figure 3.
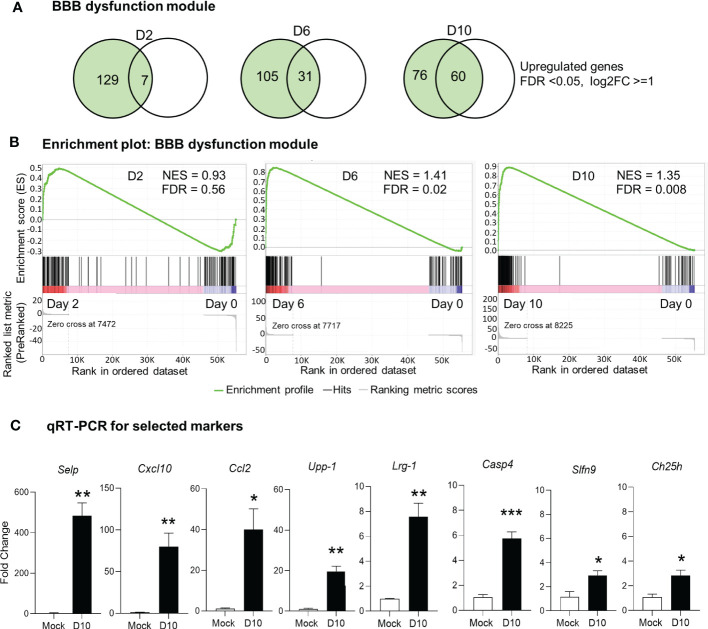
Alteration of blood brain barrier in Ot-infected mice. Brain RNA-seq experiment was performed, as in Figure 1 . (A) Venn diagram shows the numbers of unique and shared differentially expressed genes for each comparison. (B) GSEA analysis identifies significant enrichment of blood brain barrier dysfunction module at days 6 and10. (C) qRT-PCR assay confirms the upregulation of blood brain barrier related genes at day 10 as compared to mocks. A two-tailed student t test was used for comparison between two groups. *, p < 0.05; **, p < 0.01; ***, p < 0.001. The qRT-PCR data (4-5 samples/group) were from one experiment representative of three performed independently.

