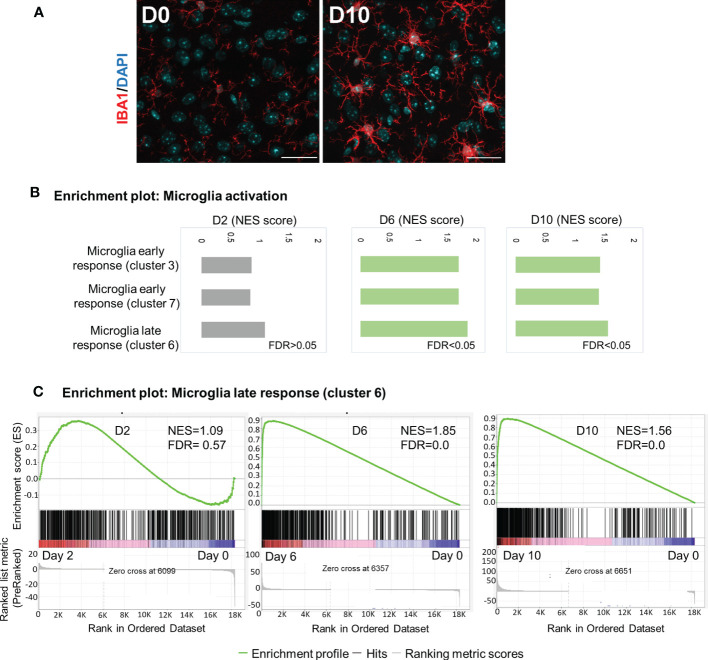
Figure 5.
Activation of microglia in mouse brain in response to Ot infection. Brain RNA-seq experiment was performed as in Figure 1 . (A) Activation of microglia at day 0 and 10 was evaluated by immunostaining (IBA1: red; DAPI: blue; Scale bars = 50 μm). Images were shown from one experiment representative of three performed independently (5 mice/group). (B) GSEA analysis identifies activation of ‘early response’ and ‘late response’ microglia gene expression signatures. (C) Enrichment plots for microglia ‘late response’ gene expression module at days 2, 6 and 10.

