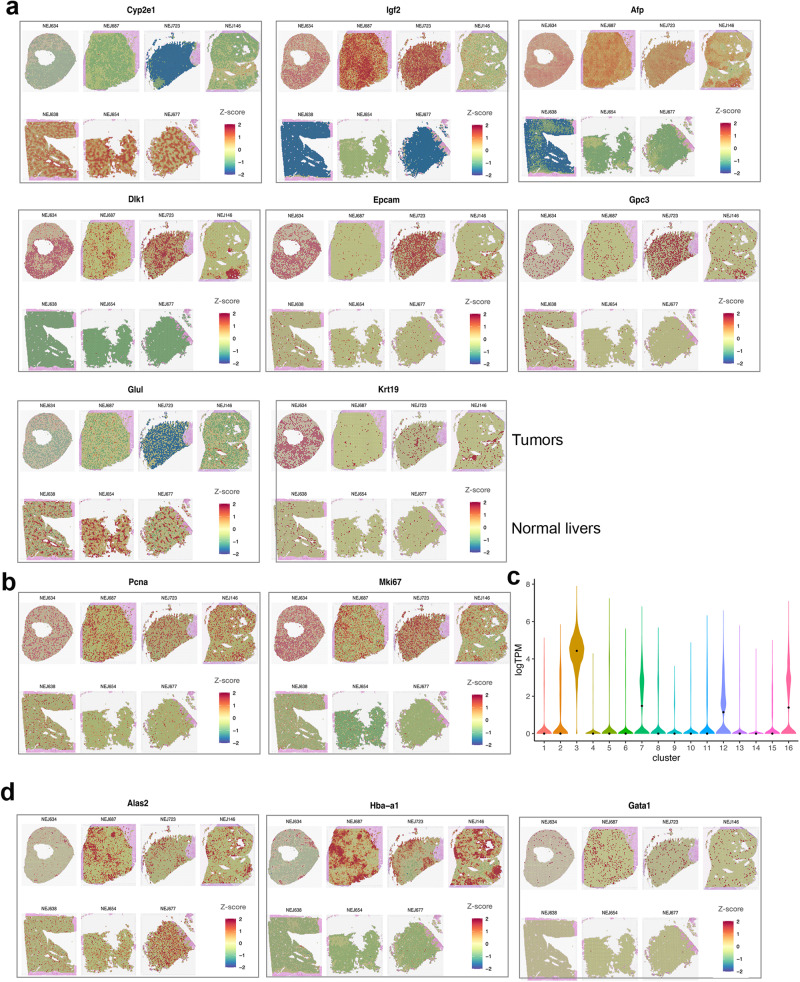
Fig. 5. Spatial transcriptomic analysis of ABC-Myc tumors validates the heterogeneity of hepatoblastoma-like cells.
a, b, d Spatial feature plots of selected marker genes Cyp2e1, Igf2, Afp, Dlk1, Epcam, Gpc3, Glul, Krt19 a, Pcna and Mki67 b, Alas2, Hba-a1, Gata1 d. In each plot, the top row is tumor samples, and the bottom row is normal liver samples. The gene-spot matrices were analyzed with the Seurat package (versions 3.0.0/3.1.3) in R. Spatial spots were colored by the z-transformed expression values across samples, showing extensive gene expression heterogeneity. c Violin plot for Mki67 expression levels across 16 clusters in single-cell RNA-seq data. Source data are provided as a Source Data file.

