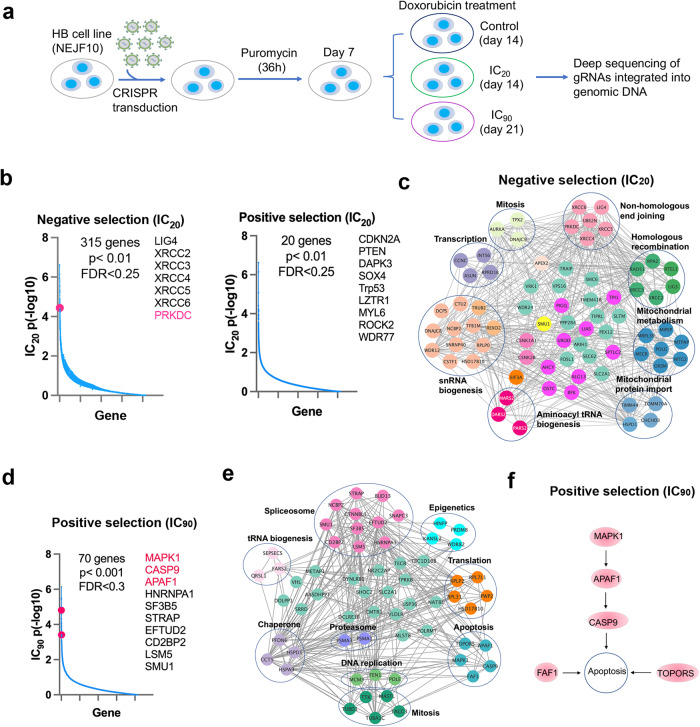
Fig. 7. Identification of genetic modifiers of chemotherapy.
a Diagram showing the procedure of genome wide CRISPR screening for the genetic modifiers of doxorubicin in NEJF10 cell line. b Negative selection and positive selection under IC20 of doxorubicin. The red dot highlighted in the graph indicates Prkdc gene that is focused on in this study. CRISPR FDR cutoff <0.25. X-axis represents the total gene number. Y axis represents the p value in -log10. P value obtained by permutation test and FDR calculated from the empirical permutation p-values using the Benjamini-Hochberg procedure by MAGeCK. c Pathways within a protein–protein interaction network enriched in negative selection under IC20 of doxorubicin. d Positive selection under IC90 of doxorubicin. CRISPR FDR cutoff <0.3. X-axis represents the total gene number. Y axis represents the p value in -log10. The genes highlighted in pink color indicates genes involved in apoptosis pathway. P value obtained by permutation test and FDR calculated from the empirical permutation p-values using the Benjamini-Hochberg procedure by MAGeCK. e, f Pathways within a protein-protein interaction network enriched in positive selection under IC90 of doxorubicin€) and apoptotic pathway f. Network analysis performed using STRING program. Source data are provided as a Source Data file.

