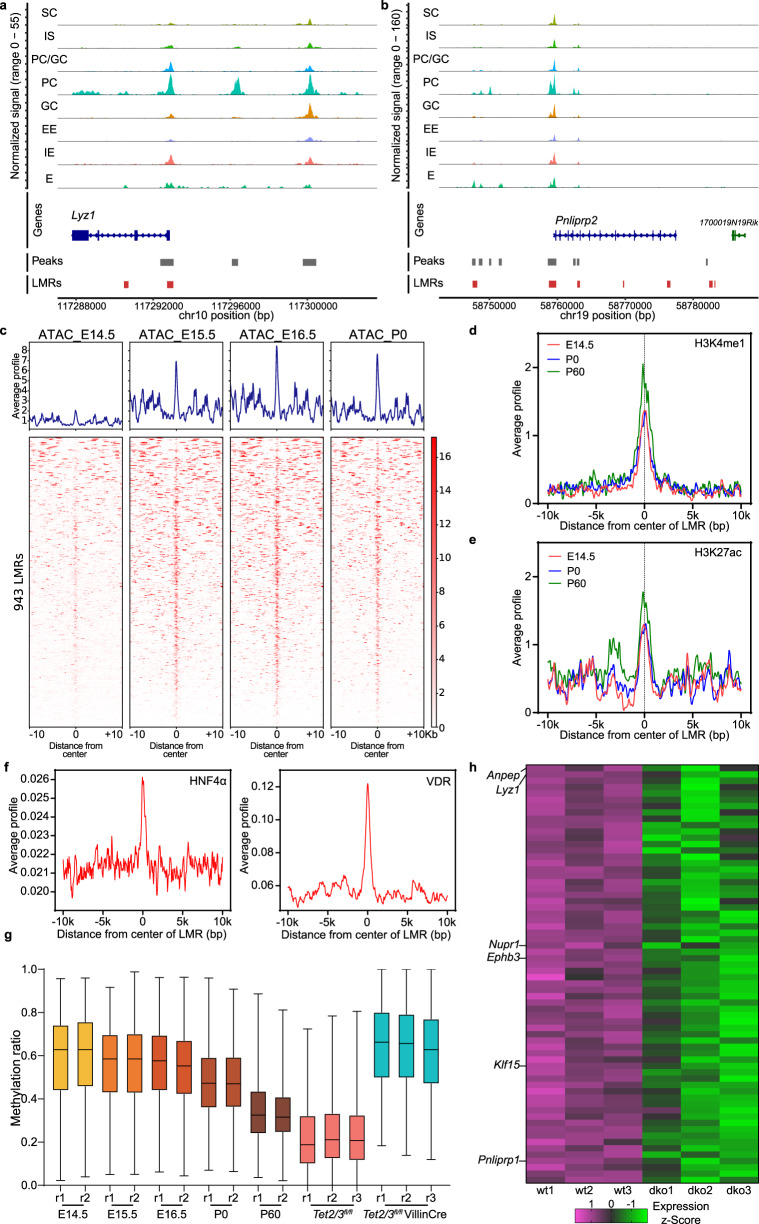
Fig. 6. TET2/3 induces profound epigenetic changes at putative enhancer regions required for Paneth differentiation.
a, b Displayed is a genomic region up- and down-stream of the PC-specific genes Lyz1 (a) and Pnliprp2 (b) showing scATAC profile of several intestinal cell types and hypermethylated LMRs. Gray-colored boxes represent scATAC peaks. Red colored boxes represent hypermethylated LMRs in dko mice. c Heatmap shows signals of published ATAC-seq data over the 943 hypermethylated LMRs that are associated with scATAC peaks of Paneth cells. d Average H3K4me1 modification profiles of 943 hypermethylated LMRs. The normalized signal of different histone modifications measured in a window of ±10,000 bp. e Average H3K27ac modification profiles of 943 hypermethylated LMRs. The normalized signal of different histone modifications was measured in a window of ±10,000 bp. f Average profile of different transcription factors (HNF4A and VDR) over the 943 hypermethylated LMRs. The normalized signal of different transcription factors was measured in a window of ±10,000 bp. g Boxplot showing the average methylation level of 943 hypermethylated LMRs that are associated with Paneth-specific genes during the indicated developmental time points. Two replicates (r1 and r2) are shown for each analyzed sample. Boxplot shows the median, the 25th and 75th percentiles, and the smallest and largest values within 1.5× the interquartile range (whiskers). h Heatmap of 66 downregulated genes that are associated with 943 hypermethylated LMRs.

