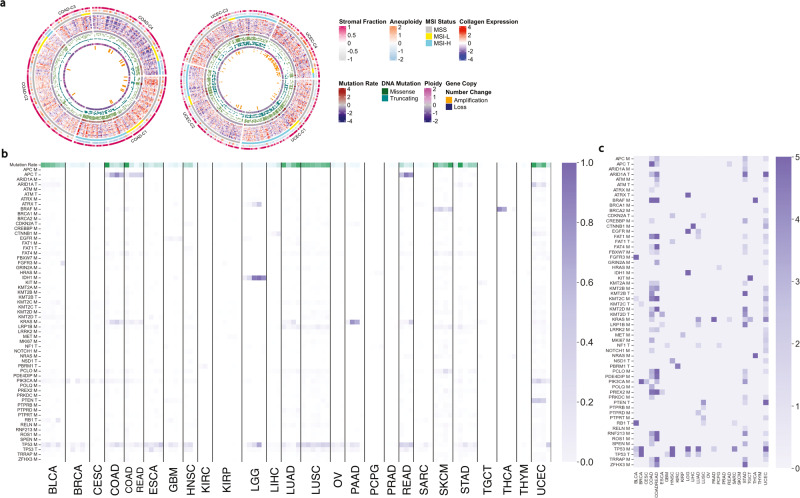
Fig. 3. Mutation rate and somatic mutations enriched in specific ColClusters.
a Circular diagrams showing the distribution of molecular alterations, mutation rate, and MSI status in colon adenocarcinoma (COAD) and endometrial carcinoma (UCEC) tumors. The molecular alterations and ECM are distinguished in these tumors. The circular diagrams for the other cancer types are shown in Supplemental Fig. 17. b Fraction of tumors in each ColCluster with the mutated gene with relative non-silent mutation rate as first row. c Heat map shows the log p values to highlight the somatic mutations with significantly biased distribution in the ColClusters for each cancer type as determined by chi-squared.

