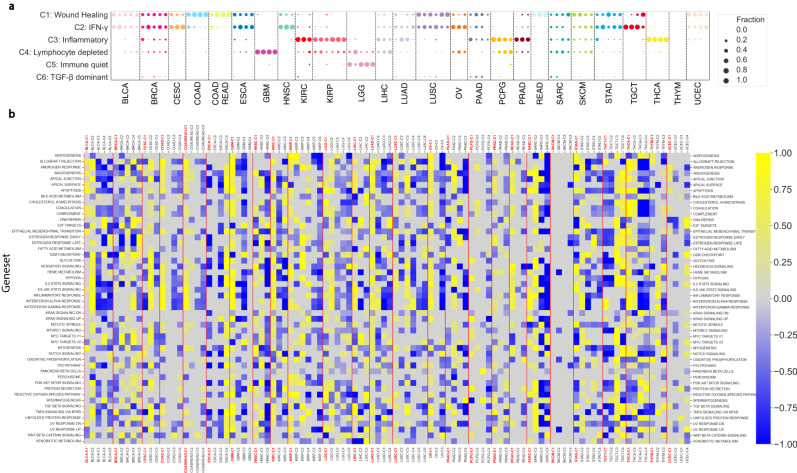
Fig. 6. Immune environments and hallmarks characterizing the ColClusters.
a Bubble plot showing bias in immune sub-types, as defined by Thorsson et al.20, across ColClusters. The bubble color indicates the cancer type and the bubble size indicates the fraction of the ColCluster with the designated immune subtype. b Heat map indicating relative enrichment of the 50 MsigDB hallmark gene sets between ColClusters as computed via QuSAGE. Each cancer type was evaluated separately.

