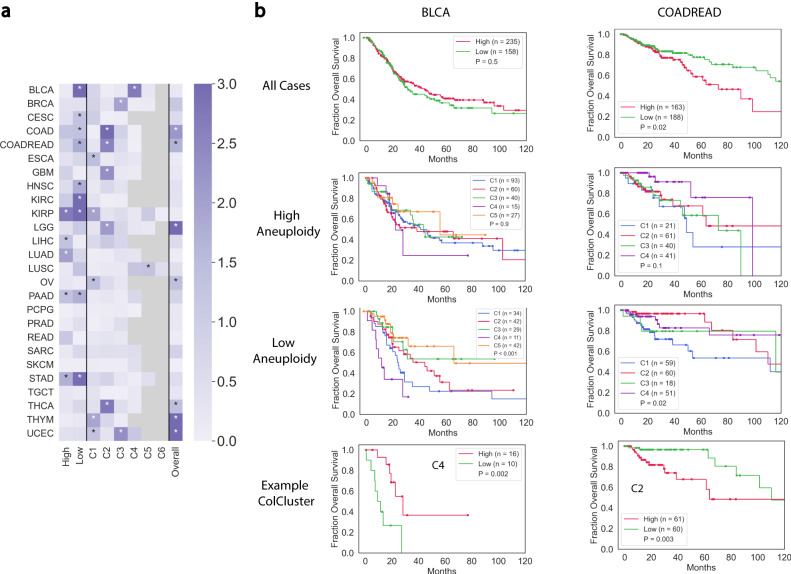
Fig. 7. ColClusters combined with aneuploidy identify tumors associated with overall survival in collagen-defined environments.
a Heat map of negative log p values from Kaplan–Meier analysis for all cases comparing patients with high and low aneuploid tumors. Clusters (high) is the −log10(p) of all the ColClusters for tumors with high aneuploidy while Clusters (low) indicates the p for the tumors with low aneuploidy. Overall is the p for all considered cases. P values were computed with the log-rank test. b Representative Kaplan–Meier curves showing the differences for high and low aneuploid tumors in ColClusters summarized in the heat map for two cancer types.

