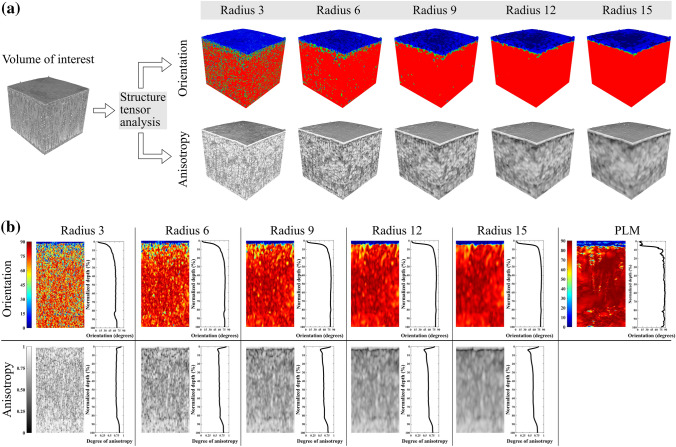
Figure 2.
(a) Visualization of the effect of the used kernel radius size to the orientation and the anisotropy analyses. The used radius sizes in the study were 3, 6, 9, 12, 15 voxels. (b) Example views in a x–z-plane of the normalized orientation and the anisotropy analyses, and the corresponding depth-wise average profiles from a healthy rabbit cartilage sample collected from the medial femoral condyle (VOI: 500 µm × 500 µm × cartilage thickness). Average profile for each sample was calculated from the normalized image stack (normalization to 200 points from the surface to the bottom of the cartilage). Each image slice (x–y-plane) was averaged to represent the value for a certain depth (z-direction). Illustration of a normalized polarized light microscopy (PLM) image (200 points from the surface to the bottom of the cartilage) collected from the medial femoral condyle of a healthy rabbit, and the corresponding depth-wise profile is presented on the right-hand side.

