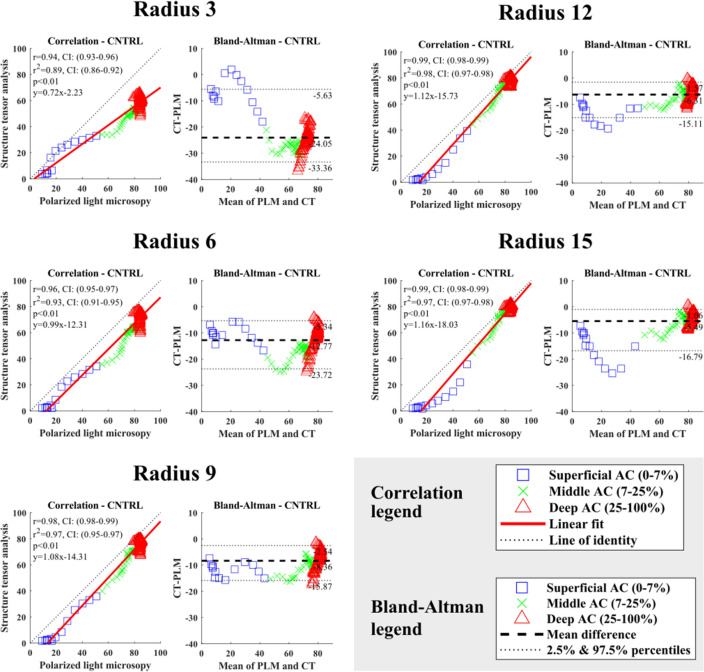
Figure 6.
The correlation and the Bland–Altman analyses of the cartilage extracellular matrix orientation acquired with polarized light microscopy (PLM) and structure tensor analysis (VOI: 150 µm × 5 µm × cartilage thickness) of the lateral femoral condyle cartilage from the healthy rabbit knee joints. The analyses are made to the normalized data. The PLM analysis is compared to the different radius sized used in the structure tensor analysis. Articular cartilage is divided into three sections in a depth-wise manner for illustrative purposes: superficial cartilage (0–7%); middle of cartilage (7–25%); deep cartilage (25–100%). This division was not used in the correlation nor Bland–Altman analyses.

