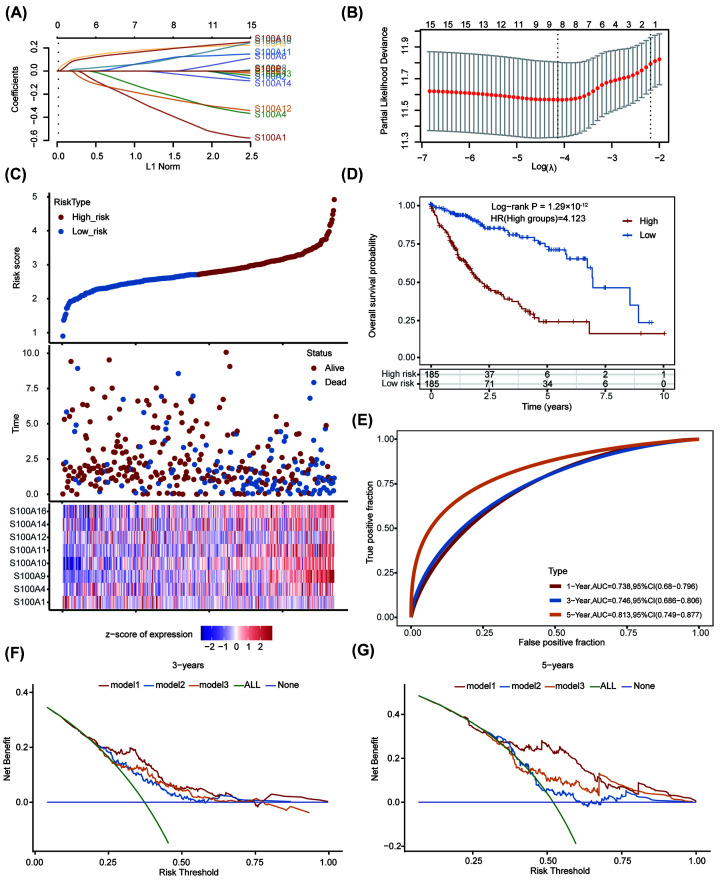
Figure 2. Construction of prognostic model based on S100 family genes.
(A) LASSO coefficient profiles and (B) partial likelihood deviance for the LASSO regression. (C) The relationship among the risk score, survival time and survival status of HCC patients in TCGA dataset. The upper panel showed the scatter diagram of the risk score (from low to high), and different colors represented different risk groups (blue points indicated low-risk group and red points indicated high-risk group); the middle panel showed the distribution of patient survival status and survival time, depicted as a vertical scatter plot; the bottom panel represented the expression heat map of the genes included in the prognostic model. (D) Kaplan–Meier curve of prognostic model. (E) 1-year, 3-year and 5-year ROC curves of the prognostic model. (F and G) The decision curve analysis of prognostic model with previous published prognostic models for 3-year (F) and 5-year OS. Abbreviations: HCC, hepatocellular carcinoma; LASSO, least absolute shrinkage and selection operator; OS, overall survival; ROC, receiver operating characteristic; TCGA, The Cancer Genome Atlas.

