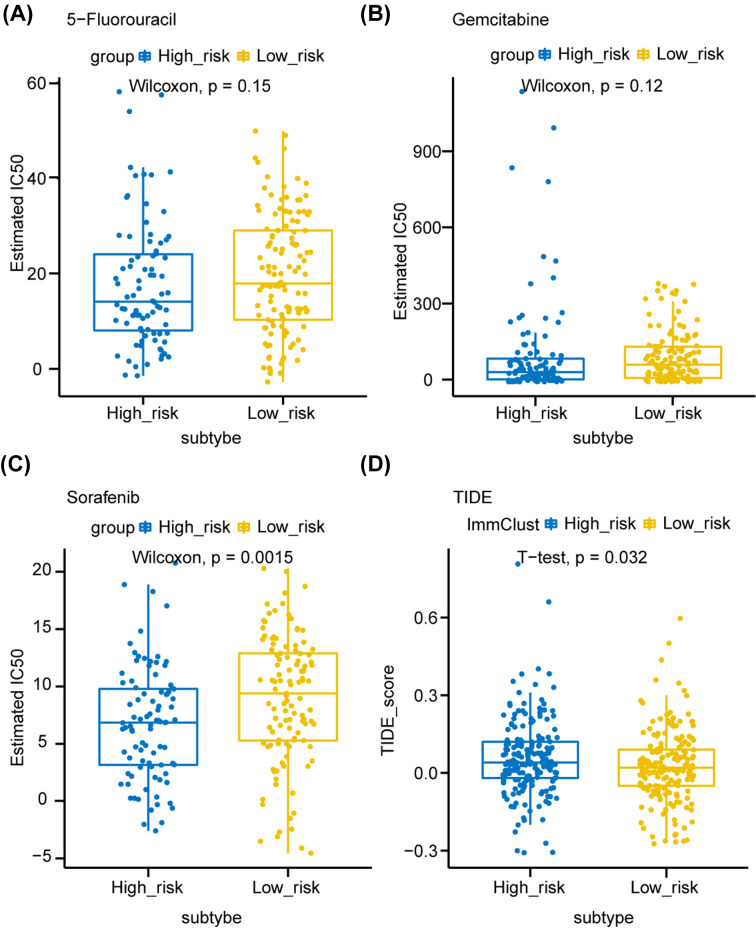
Figure 5. Predictive therapeutic response based on the risk score model.
(A–C) The box plots showed the estimated half maximal inhibitory concentration (IC50) for 5-fluorouracil (A), gemcitabine (B) and sorafenib among S100 family members-based subtypes. (D) The box plot of TIDE scores of high- and low-risk groups, indicating the predictive therapeutic response to immune checkpoint blockage therapy. Comparisons between continuous variables were performed using the Wilcoxon rank-sum test or two-sample t-test depending on normality. Abbreviation: TIDE, tumor immune dysfunction and exclusion.

