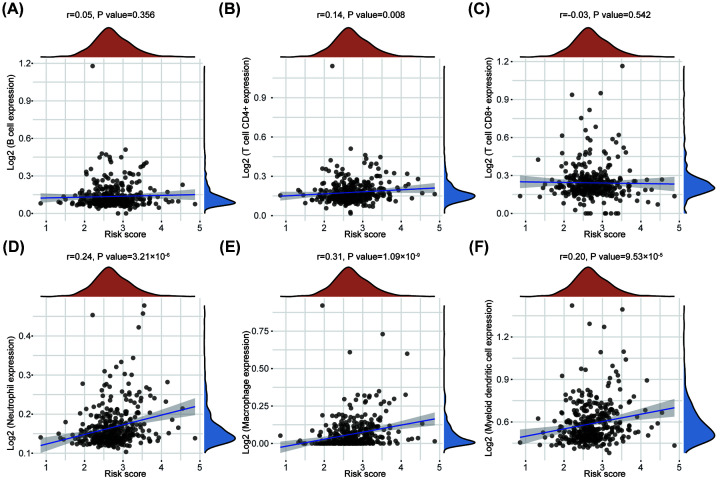
Figure 6. Correlation between risk score and tumor-infiltrating immune cells.
(A–F) The correlations between risk score and immune score of different kinds of immune cells was analyzed with Spearman correlation. The horizontal axis represents the distribution of the risk score, and the longitudinal axis represents the distribution of the immune score of different immune cells. The right density curve showed the distribution of the immune scores among patients. The upper density curve represented the trend in distribution of the risk score.

