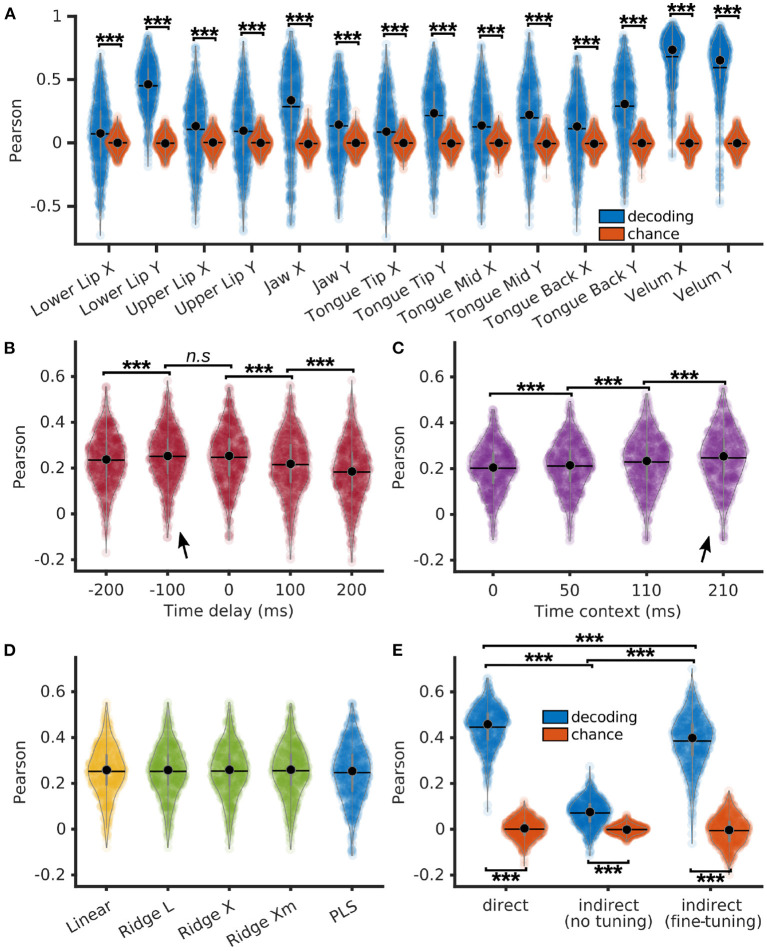
Figure 4.
Indirect decoding of Mel cepstrum from brain activity through an articulatory representation using PLS regression. (A) Pearson correlations of decoded EMA (blue) and their matching chance levels (red) using PLS regression with 12 components. (B) Pearson correlations of decoded EMA using PLS regression with 12 components, 210 ms of time context and varying time delays. (C) Pearson correlations of decoded EMA using PLS regression with 12 components, 0 ms of delay and varying time contexts. (D) Pearson correlations of decoded EMA using linear/ridge regressions with PCA reduction (100 components) and PLS regressions with 12 components. Ridge regressions were trained using 3 different methods to compute the λ factor: L-curve (L), cross-validation (X) and cross-validation with individual λ per features (Xm). (E) Pearson correlations of decoded Mel cepstrum (blue) and their matching chance levels (red) using either 1. direct decoding with PLS regression (direct), 2. indirect prediction from decoded EMA with a articulatory-to-acoustic DNN without fine tuning or 3. indirect prediction with fine tuning. Statistical significance with respect to chance levels on (A, E) computed with Bonferroni-corrected Wilcoxon signed-rank test (see values in Section 3.3). Statistical significance computed by Quade-Conover test for (B) [Quade test: p < 0.001, t(4,2516) = 75.1], (C) [Quade test: p < 0.001, t(3,1887) = 369.2], and (E) [Quade test: p < 0.001, t(2,1258) = 1033.1]. Conover comparisons for (B–E): n.s: p ≥ 0.05 [(B): t(2516) = 0.99], ***p < 0.001 [(B): t(2516) > 4, 8, (C): t(1887) > 8.8, (E): t(1258) > 29.9]. Arrows indicate best accuracies.

