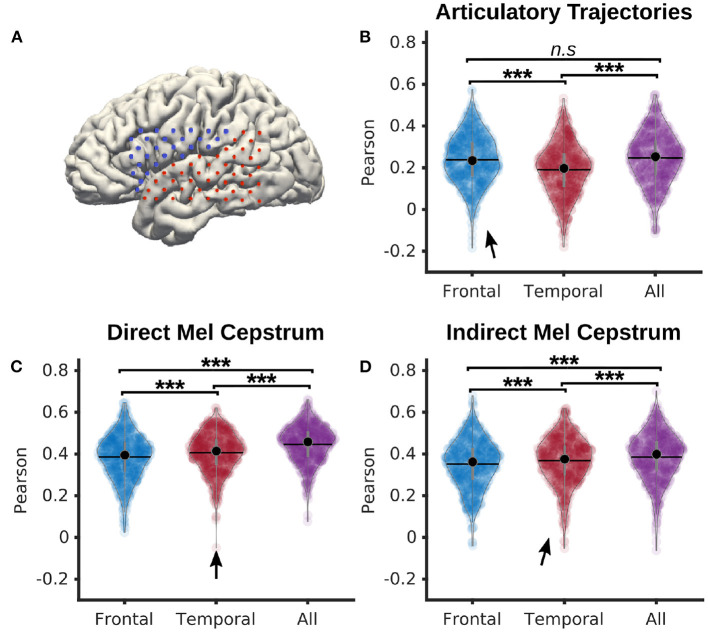
Figure 5.
Comparison of frontal and temporal electrodes for decoding of speech from P5 dataset. (A) Map of frontal (blue) and temporal (red) electrodes of P5 dataset. (B) Pearson correlations of articulatory trajectories decoded by a PLS regression with 12 components from either frontal, temporal, or all electrodes (median correlations r = 0.24, r = 0.20, r = 0.25 for frontal, temporal, and all electrodes, respectively). (C) Pearson correlations of Mel cepstral coefficients decoded by a PLS regression with 12 components from either frontal, temporal, or all electrodes (median correlations r = 0.39, r = 0.40, r = 0.45 for frontal, temporal, and all electrodes, respectively). (D) Pearson correlations of Mel cepstral coefficients predicted from decoded articulatory trajectories using an articulatory-to-acoustic DNN from either frontal, temporal, or all electrodes (median correlations r = 0.38, r = 0.38, r = 0.41 for frontal, temporal, and all electrodes respectively). Statistical significance computed using Quade-Conover. Quade tests: p < 0.001 [t(2,1258) > 30.5]. Conover comparisons for (B–D): n.s: p ≥ 0.05 [(B): t(1258) = 0.8], ***p < 0.001 [(B–D): t(1258) > 3.6]. Arrows indicate best accuracies.

