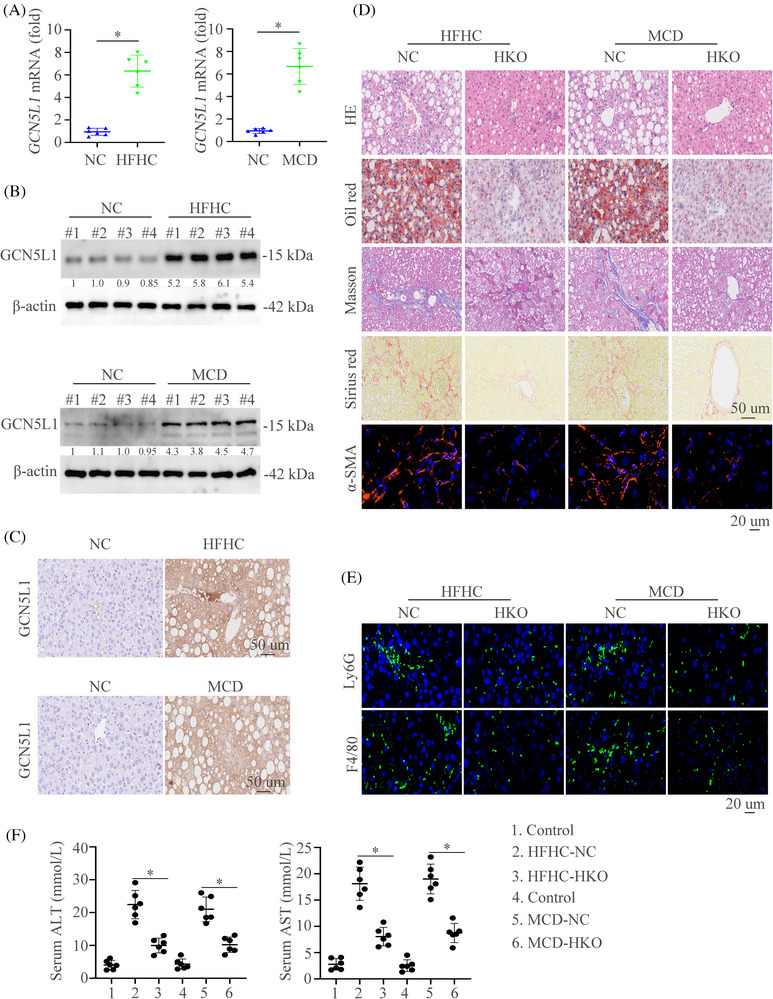
FIGURE 2.

Upregulated GCN5L1 level is shown in mouse NASH models and hepatic GCN5L1 deficiency ameliorates diet‐induced NASH (A) Hepatic mRNA in wildtype (WT) mice fed the control, HFHC, or MCD diet. (B) Protein levels in wildtype (WT) mice fed the control, HFHC, or MCD diet. (C) Immunohistochemical (IHC) showed the GCN5L1 expression in indicated mice groups. (D) Hematoxylin and eosin (H&E), Oil Red O, Masson, Sirius Red, and α‐SMA staining were shown in WT or GCN5L1 HKO mice fed with HFHC, or MCD diet. (E) Representative immunofluorescence (IF) staining showed Ly6G and F4/80. (F) Graphs showed the serum alanine transaminase (ALT) and aspartate aminotransferase (AST) in mice (n = 6/group). Scale bars indicate 50 μm for IHC and 20 μm for IF. Error bars represent mean ± SD. *p < 0.05.
