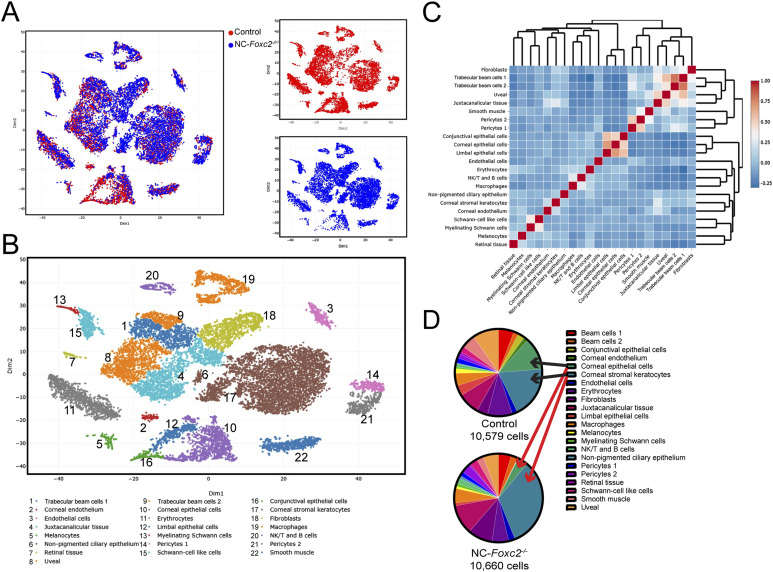
Figure 3. Single-cell transcriptome profiling of cell populations in the anterior eye segment of Control and NC-Foxc2-/- mice.
(A, B) Visualization of individual cell contribution (A) and unsupervised clustering analysis of 22 transcriptionally distinct cell populations (B) by t-distributed stochastic neighbor embedding in the anterior eye segment of 3–4-wk-old Foxc2fl/fl Control and NC-Foxc2-/- mice. (C) Correlation heatmap and hierarchical clustering of gene-expression signatures of all cell populations. (D) Pie charts demonstrating the proportion of the total cell number analyzed contributing to each individual cell cluster for Control and NC-Foxc2-/- mice.
Source data are available for this figure.

