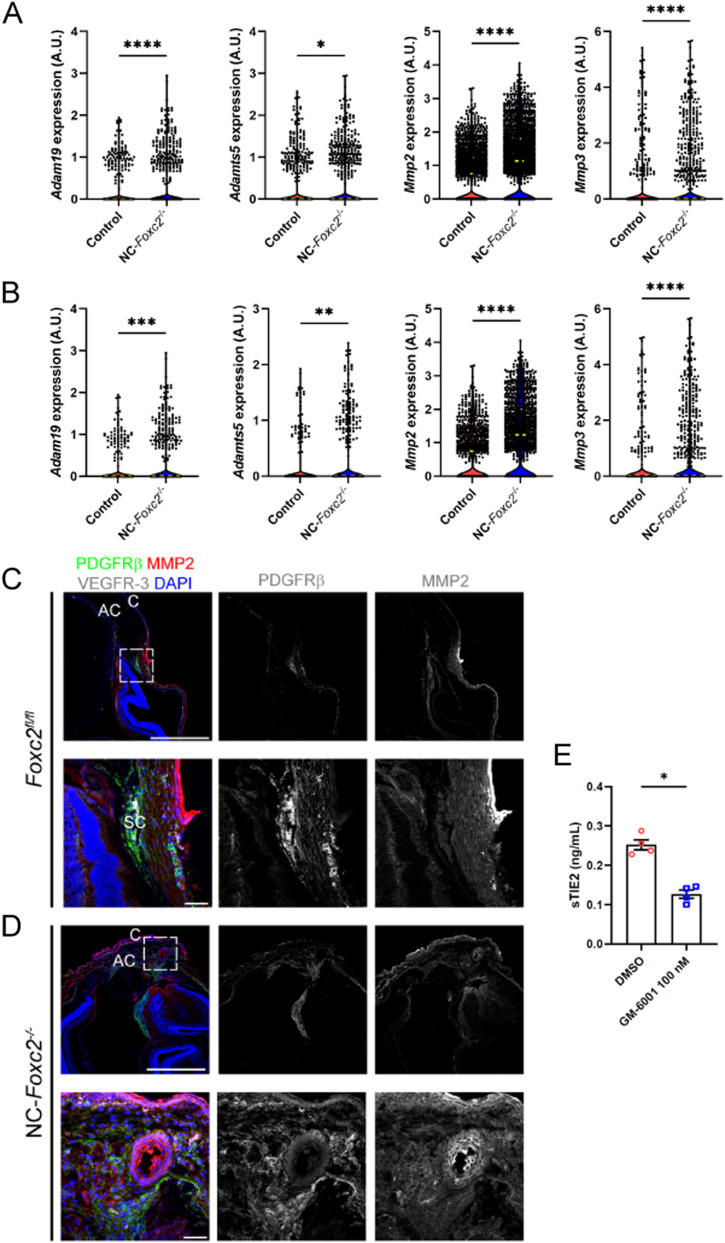
Figure 5. sc-RNA seq analysis of genes related to MMP.
(A, B) sc-RNA seq analysis identifies differentially expressed genes related to MMPs between Control and NC-Foxc2-/- mice in cells comprising the trabecular meshwork (A) and trabecular meshwork 3 (B) clusters. Violin plots showing differential expression of Adam19, Adamts5, Mmp2, and Mmp3 in the TM cluster (A) and TM-3 cluster (B) between Control and NC-Foxc2-/- mice. Long, dashed lines denote median values. Statistical analysis: Mann–Whitney Test. *P < 0.05, **P < 0.01, ***P < 0.001, ****P < 0.0001. (C, D) Representative cross-section images of the iridocorneal angle and anterior chamber of a Foxc2fl/fl control (C) and NC-Foxc2-/- individual (D) immunostained with PDGFRβ, MMP2, VEGFR-3, and DAPI. Boxed regions in top panels denote magnified regions in lower panels. Scale bars are 500 μm and 50 μm, respectively. C, cornea; AC, anterior chamber; SC, Schlemm’s canal. (E) Quantification of sTIE2 in conditioned media from cultured HDLECs treated with DMSO vehicle or GM-6001 at 100 nM by ELISA (E). Data are mean ± SD from three biological replicates. Statistical analysis: Mann–Whitney U test. *P < 0.05.
Source data are available for this figure.

