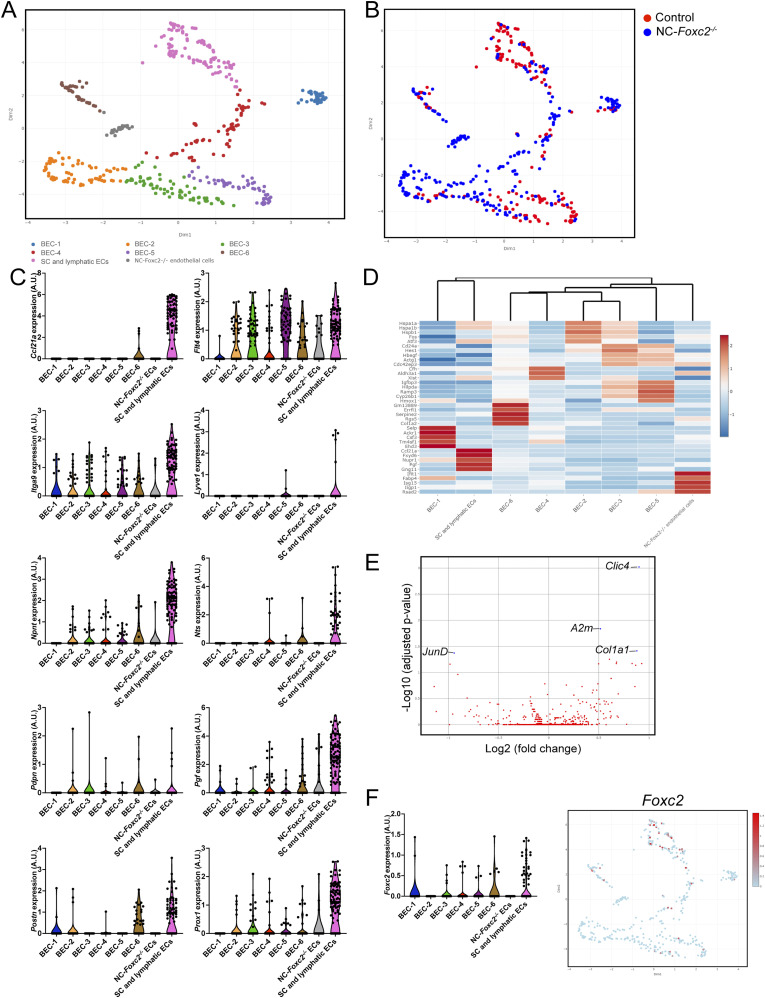
Figure 6. Single-cell transcriptome profiling of endothelium in the anterior eye segment of Control and NC-Foxc2-/- mice.
(A, B) Visualization of unsupervised subclustering analysis of eight transcriptionally distinct endothelial cell populations (A) and individual cell contribution (B) by Uniform Manifold Approximation and Projection of the endothelial cell cluster identified in Fig 4B. (C) Violin plots showing the expression of gene markers from the endothelial subclusters. (D) Feature heatmap and hierarchical clustering of gene-expression levels of the top five marker genes for each endothelial subcluster. Colors represent row-wise scaled gene expression with a mean of 0 and SD of 1 (Z scores). (E) Volcano plot showing DEGs between NC-Foxc2-/- and Foxc2fl/fl Control mice in the lymphatic-like endothelium subcluster. Blue points denote DEGs with adjusted P-value < 0.05. (F) Violin plot (left panel) and Uniform Manifold Approximation and Projection (right panel) showing the expression of Foxc2 in each endothelial subcluster.
Source data are available for this figure.

