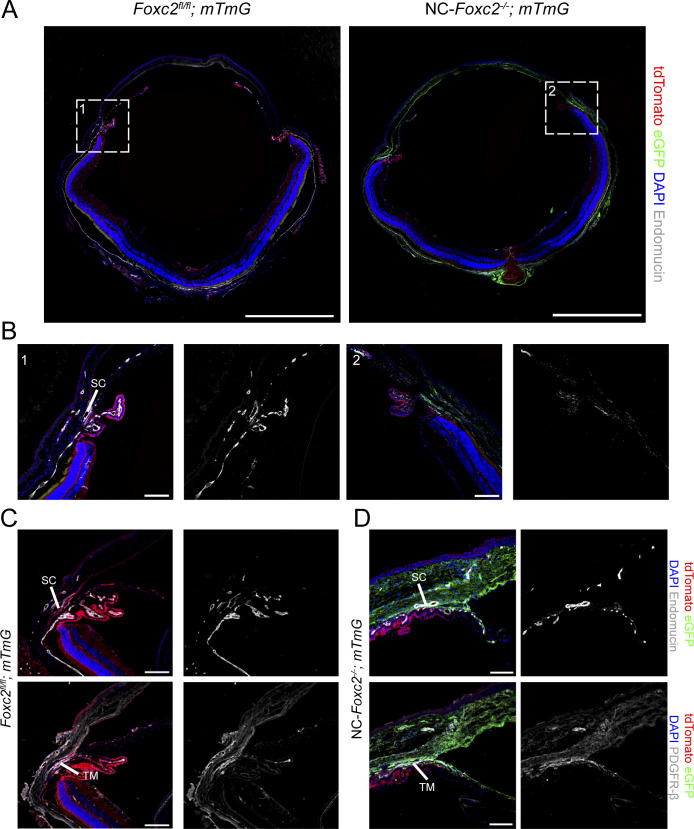
Figure S2. Fate-mapping of neural crest-derived cell populations in NC-Foxc2-/- mice.
(A) Representative images of eye sections from 3-wk-old control Foxc2fl/fl; mTmG and NC-Foxc2-/-; mTmG mice immunostained with antibody against endomucin where eGFP expression is regulated by Wnt1-Cre-mediated recombination. Scale bars are 1 mm. (A, B) Magnified images of boxed regions denoted in (A). Scale bars are 100 μm. (C, D) Representative images of sections of the iridocorneal angle from a 3-wk-old NC-Foxc2-/-; mTmG individual with a severe phenotype (D) compared with a control Foxc2fl/fl; mTmG individual immunostained with antibody against endomucin or PDGFR-β. Scale bars are 100 μm.

