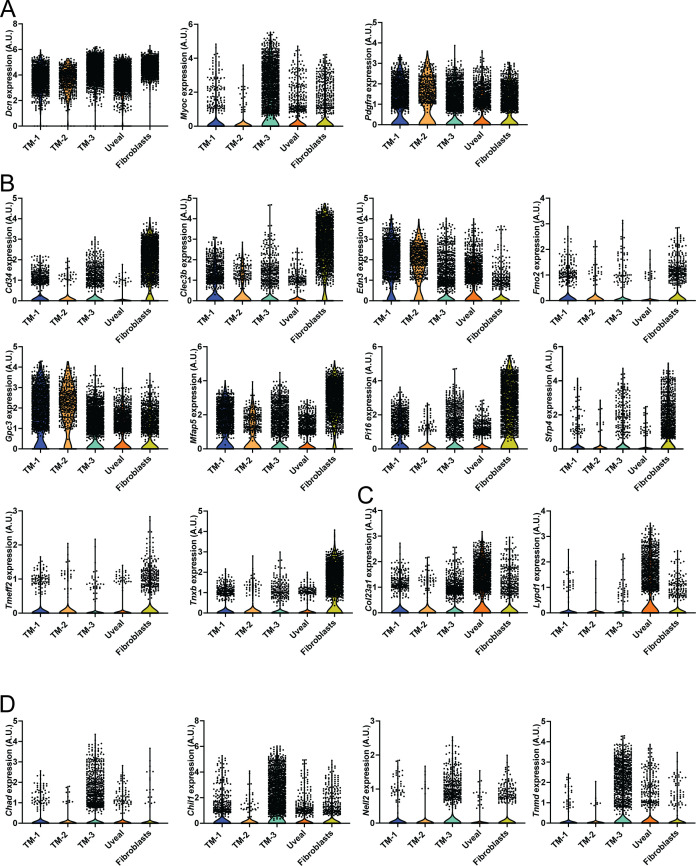
Figure S5. Characterization of trabecular meshwork clusters.
(A, B, C, D) Violin plots showing the expression of Dcn, Myoc, and Pdgfra (A), Cd34, Clec3b, Edn3, Fmo2, Gpc3, Mfap5, Pi16, Sfrp4, Tmeff2, and Tnxb (B), Col23a1, and Lypd1 (C), Chad, Chil1, Nell2, and Tnmd (D) from trabecular meshwork, uveal meshwork, and fibroblast clusters. Clusters are color coded as in Fig 3.
Source data are available for this figure.

