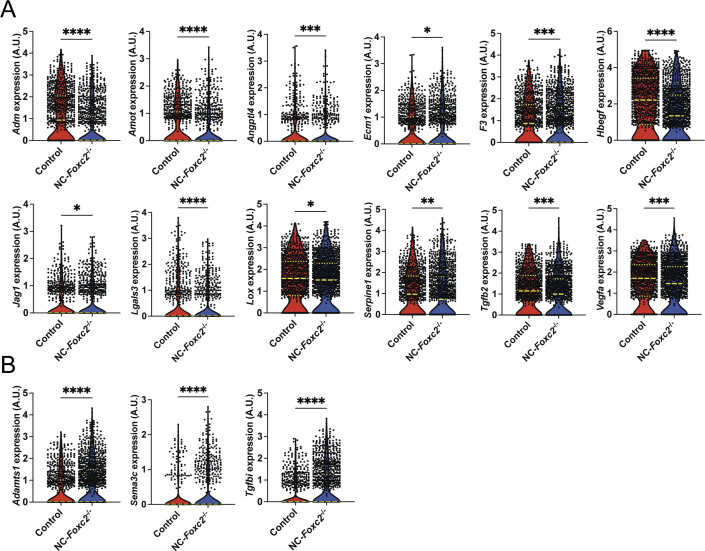
Figure S6. sc-RNA seq analysis identifies differentially expressed genes related to angiogenesis and ECM organization between Control and NC-Foxc2-/- mice in cells comprising the trabecular meshwork 3 cluster.
(A, B) Violin plots showing differential expression of Adm, Amot, Angptl4, Ecm1, F3, Hbegf, Jag1, Lgals3, Lox, Serpine1, Tgfb2, and Vegfa (A), Adamts1, Sema3c, and Tgfbi (B) between Control and NC-Foxc2-/- mice. Long, dashed lines denote median values. Statistical analysis: Mann–Whitney Test. *P < 0.05, **P < 0.01, ***P < 0.001, ****P < 0.0001.
Source data are available for this figure.

