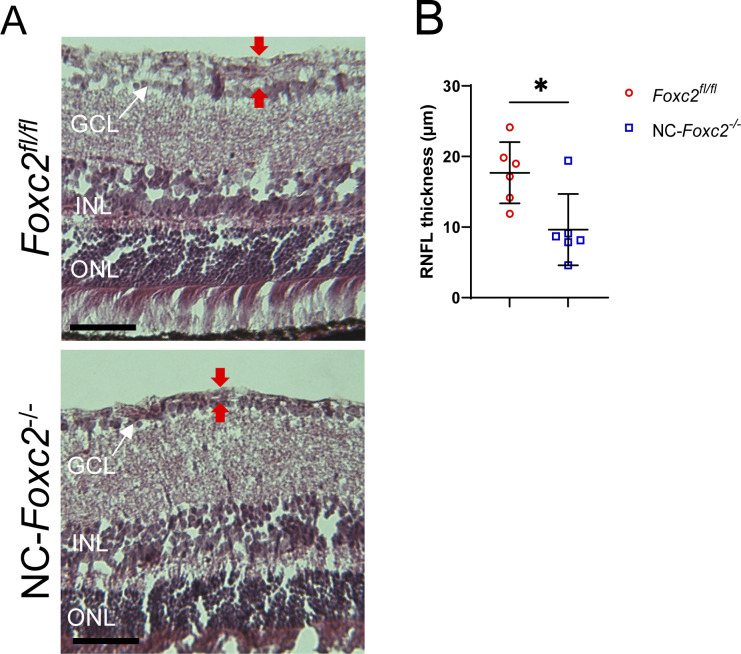
Figure S9. Characterization of retina nerve fiber layer thickness in NC-Foxc2-/- mice.
(A, B) Representative images and quantification of retina nerve fiber layer thickness from hematoxylin and eosin-stained sections. Scale bars are 50 μm. N = 6 Foxc2fl/fl control and N = 6 for NC-Foxc2-/- mice. Data are mean ± SD. Statistical analysis: unpaired t test. *P < 0.05. ONL, outer nuclear layer, INL, inner nuclear layer, GCL, ganglion cell layer.
Source data are available for this figure.

