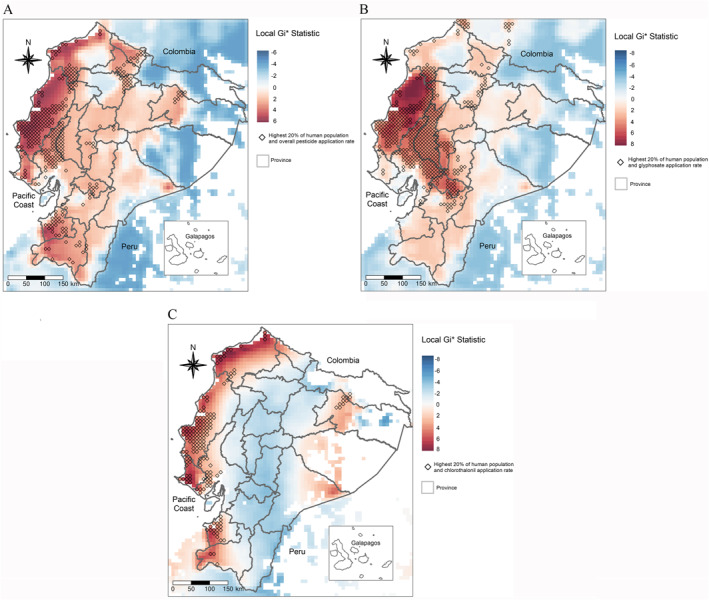
Figure 4.

(a) Getis‐Ord Gi* statistic for overall pesticide application rates. Diamonds indicate areas where the highest 20% of human population density and the highest 20% of pesticide application rates overlap; (b) Getis‐Ord Gi* statistic for glyphosate application rates. Diamonds indicate areas where the highest 20% of human population density and the highest 20% of pesticide application rates overlap; (c) Getis‐Ord Gi* statistic for chlorothalonil application rates. Diamonds indicate areas where the highest 20% of human population density and the highest 20% of pesticide application rates overlap. Note: The Getis‐Ord Gi* statistic z‐score provides information on the intensity of the data clustering. Statistical significance was set to 99.9% for pesticide application rates hotspots (z‐score > 3.29). Application rates were not available for the Galapagos Province.
