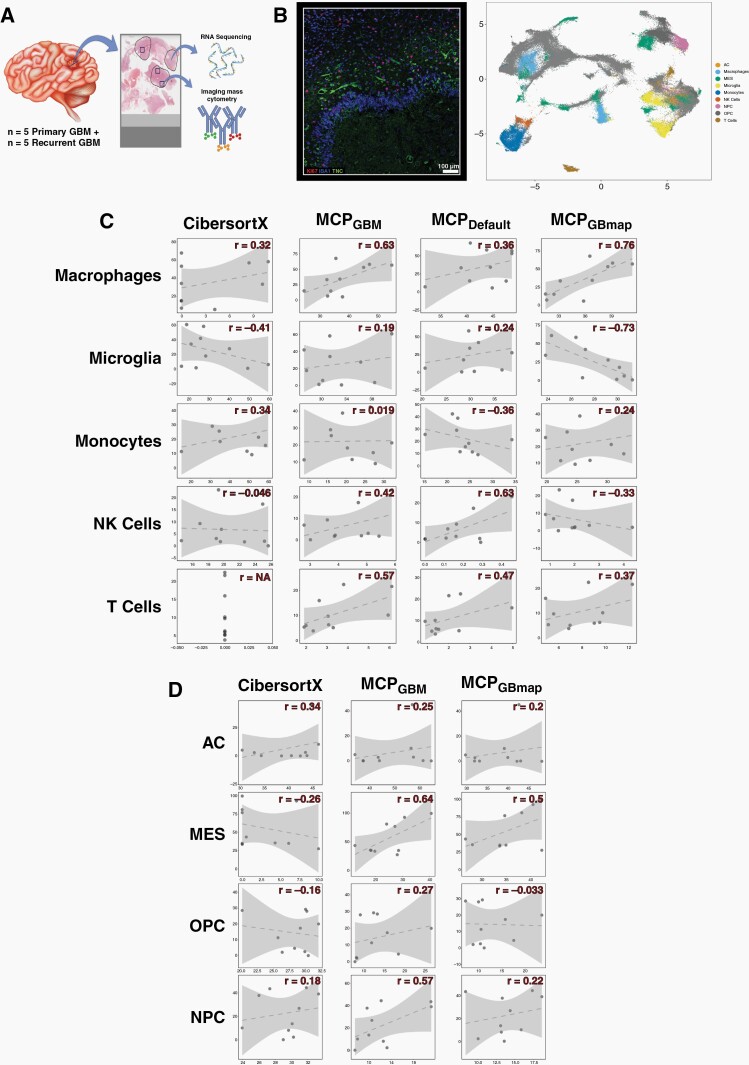
Figure 2.
(A) A schematic showing how patient samples were used for validation. Regions of formalin fixed tissue sections were annotated as high tumour cell content by a neuropathologist (circled) and were macro-dissected for RNA sequencing. At least three overlapping regions (squares) per sample were subjected to imaging mass cytometry (IMC) on a consecutive section. Brain schematic taken from Vecteezy.com (B) Left: A representative image from the IMC for GBM sample 64 with three of the chosen protein markers annotated. Right: The UMAP projection of cell types assigned according to the expression of cell type protein markers quantified by IMC. (C, D) Scatterplots of gold standard cell proportions quantified by IMC (y-axis) versus those predicted by gene expression based methods (annotated across the top) for immune (C) or neoplastic cancer (D) cell types indicated down the side. The Pearson’s correlation coefficient (r) is indicated. The dotted line is the line of best fit and the shaded area denotes the confidence interval. Marker genes for MCPcounter were either default (MCPdefault), GBM-specific according to our research (MCPGBM) or GBM-specific according to GBMap (MCPGBMap) Neoplastic cells are astrocyte-like (AC), oligodendrocyte progenitor-like (OPC), neuronal progenitor-like (OPC) or mesenchymal (MES).

