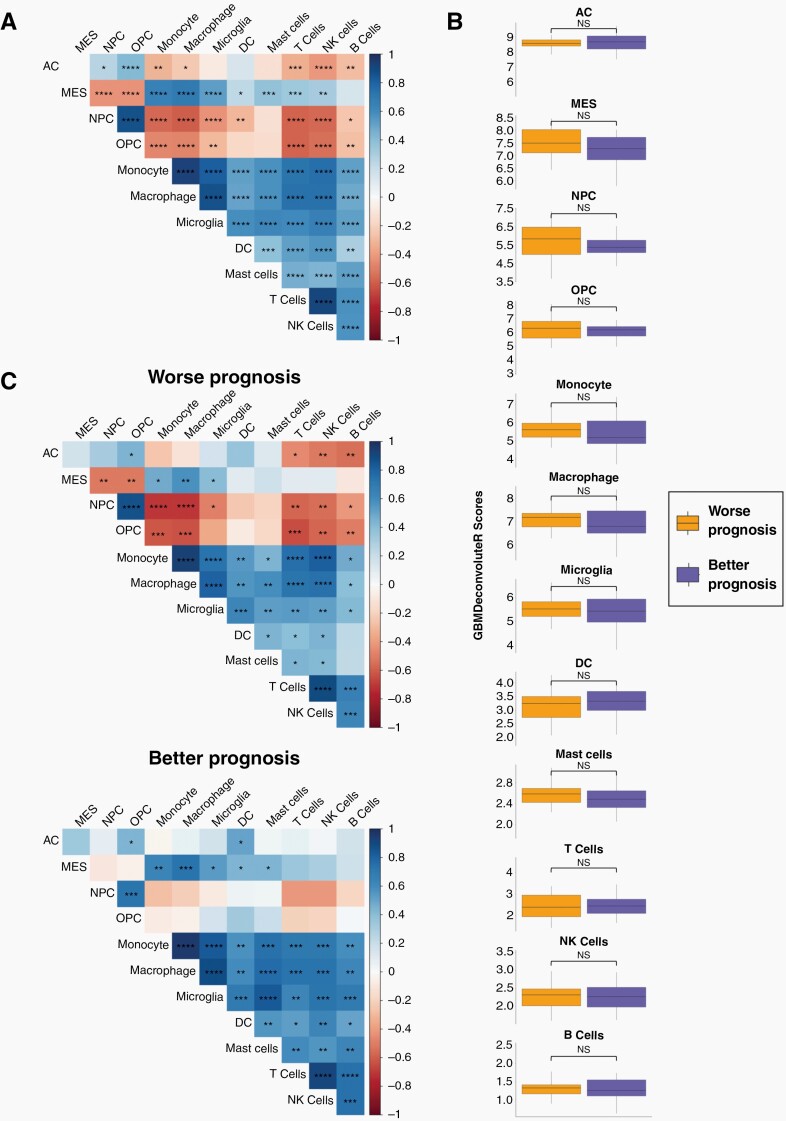
Figure 3.
MCPGBM was used to score cell types in bulk GBM RNAseq data from The Cancer Genome Atlas (TCGA). (A) Heatmap of the correlations between cell type scores across all samples. (B) Boxplots showing distribution of cell type scores for patients with worse or better prognosis (determined by the lower and upper quartile of overall survival, respectively). (C) Heatmap of the correlations between cell type scores across samples from patients with worse (left) or better (right) prognosis. Significance is denoted by asterisks: *P < .05; **P < .01; ***P < .001; ****P < .0001; NS, not significant.

