
Fig. 1.
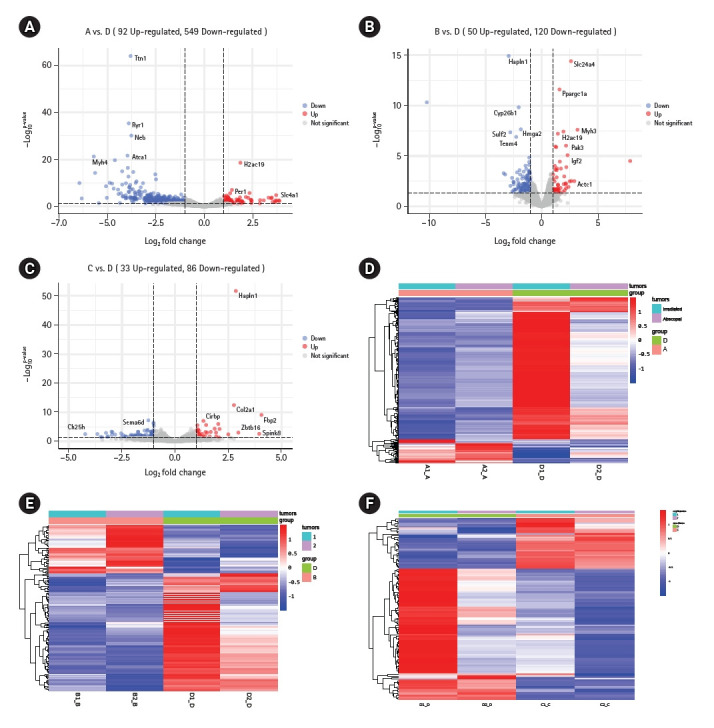
Genes change differently under different treatment modes. (A–C) The volcanic maps show the differences in gene expression between the combination therapy group and the control group, immunotherapy group, and radiation therapy group, respectively. (D–F) The thermograms show the differential genes between irradiated tumor and abscopal tumor "A" represents blank control group, "B" represents simple immunotherapy group, "C" represents radiotherapy group, "D" represents radiotherapy combined immunotherapy group, "1" represents primary tumor, and "2" represents secondary tumor (the same below). p < 0.05 was statistically significant.