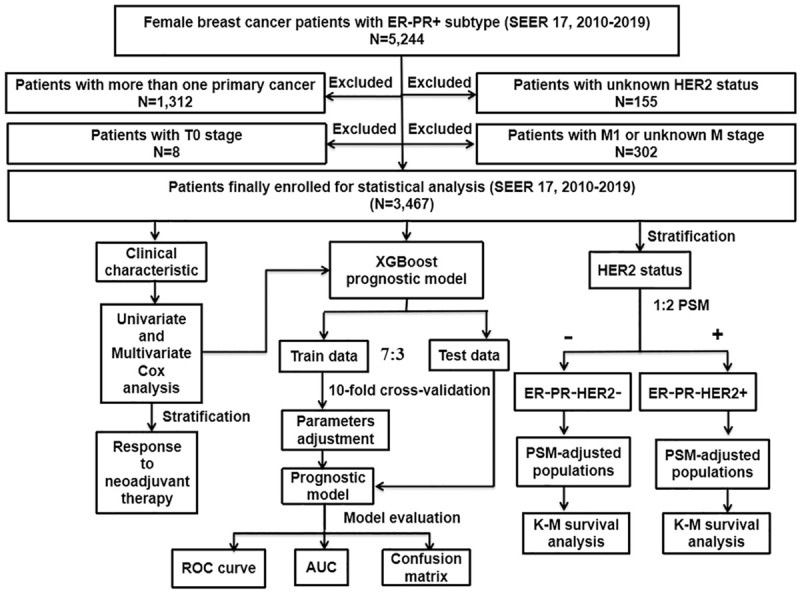
Figure 1.

Flowchart describing the procedure and statistical analysis. SEER: the Surveillance, Epidemiology, and End Results; ER+/-: estrogen receptor positive/negative; PR+/-: progesterone receptor positive/negative; HER2+/-: human epidermal growth factor receptor 2 positive/negative; PSM: propensity score matching; Cox: concordance index; ROC curve: receiver operating characteristic curve; AUC: area under the curve; K-M: Kaplan-Meier; XGBoost: extreme gradient boosting.
