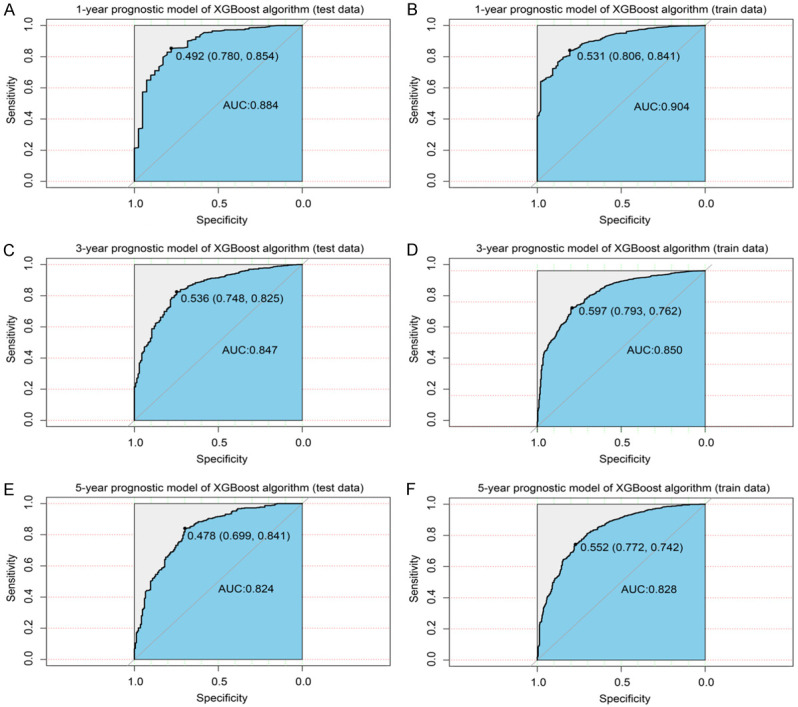
Figure 6.

XGBoost model evaluation. A. ROC curve for the test data (1-year prognostic model); B. ROC curve for the train data (1-year prognostic model); C. ROC curve for the test data (3-year prognostic model); D. ROC curve for the train data (3-year prognostic model); E. ROC curve for the test data (5-year prognostic model); F. ROC curve for the train data (5-year prognostic model). ROC: receiver operating characteristic curve; XGBoost: extreme gradient boosting.
