Figure 2.
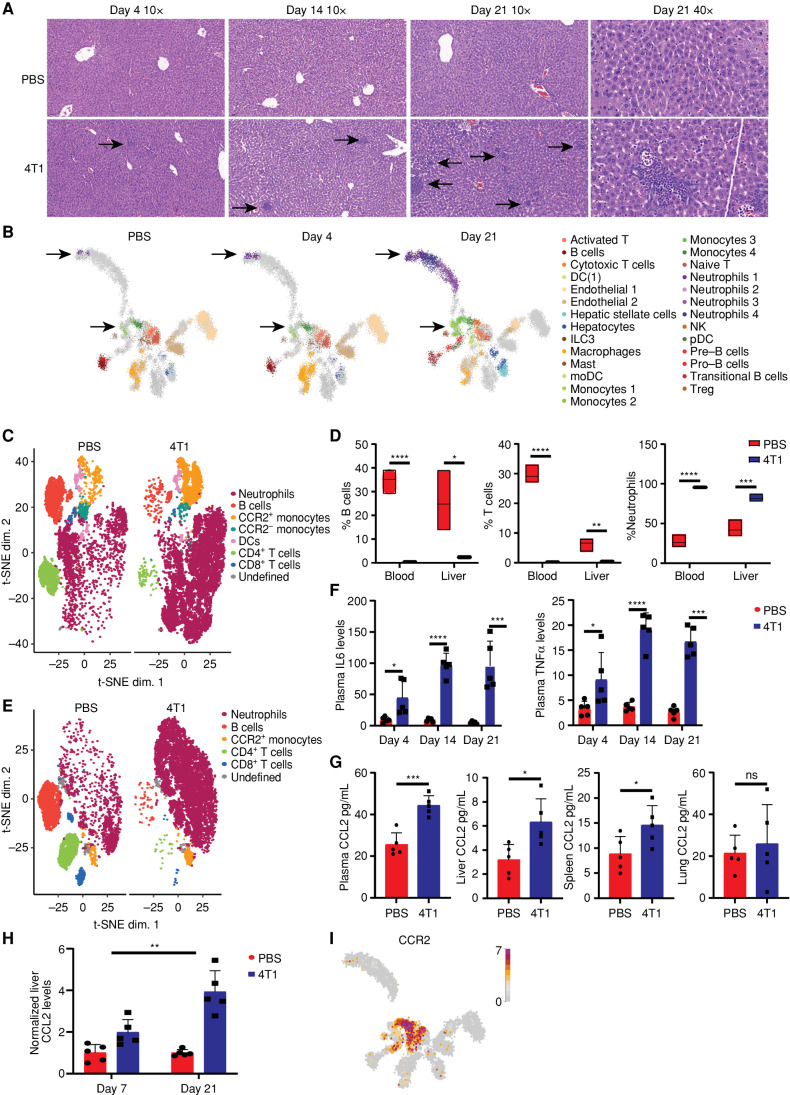
Innate immune cells infiltrate the host's liver during early breast carcinogenesis. A, Hematoxylin and eosin staining of liver sections demonstrates increased immune cell infiltration along a time course following breast cancer cell injection. The black arrows point to the infiltrating immune cells. Magnifications: 10 and 40× as detailed in the figure. B, Cell types annotated from the scRNA-seq analysis are projected on three uniform manifold approximation and projections (UMAP), indicating which cells appear at which time point. The arrows mark the neutrophil and monocyte subsets that were absent in the liver of WT mice and gradually accumulated in the liver until day 21. DC, dendritic cell; moDC, monocyte-derived dendritic cell; NK, natural killer; pDC, plasmacytoid dendritic cell; Treg, regulatory T cell. C–E, CyTOF-t-distributed stochastic neighbor embedding (t-SNE) analysis (C and E) and (D) quantification of liver and blood CD45+ populations show increased levels of innate immune cells and reduction of lymphocytes in the liver (C) and blood (E) of breast cancer–bearing mice compared with WT PBS-injected mice (WT n = 3, 4T1 = 5, Student t test). P values for blood <0.0001. P values for liver: B cells = 0.013, T cells = 0.0014, neutrophils = 0.0001. F, Multiplex ELISA immunoassay demonstrates increasing levels of IL6 (left) and TNFα (right) in breast cancer–bearing mice from day 4 to day 21 following cancer cell injection (n = 5, Student t test). P values for IL6: day 4 = 0.024, day 14 <0.0001, and day 21 = 0.0009. P values for TNFα: day 4 = 0.05, day 14, and day 21 <0.0001. G, ELISA assay measurements of CCL2 levels in plasma, livers, spleens, and lungs of breast cancer–bearing mice (n = 5, Student t test). P values: plasma = 0.0005, liver = 0.017, spleen = 0.04. H, ELISA assay demonstrates a significant interaction effect between the time following cancer cell injection and elevation of CCL2 in the liver of breast cancer–bearing mice relative to WT PBS-injected mice (n = 5, two-way ANOVA); P = 0.0034. I, Expression of CCR2 in immune cells from the scRNA-seq experiment, projected on the UMAP, demonstrates that CCR2 is mainly expressed in monocyte subpopulations.

