. 2023 Mar 27;13(7):1616–1635. doi: 10.1158/2159-8290.CD-22-1062

Figure 3.

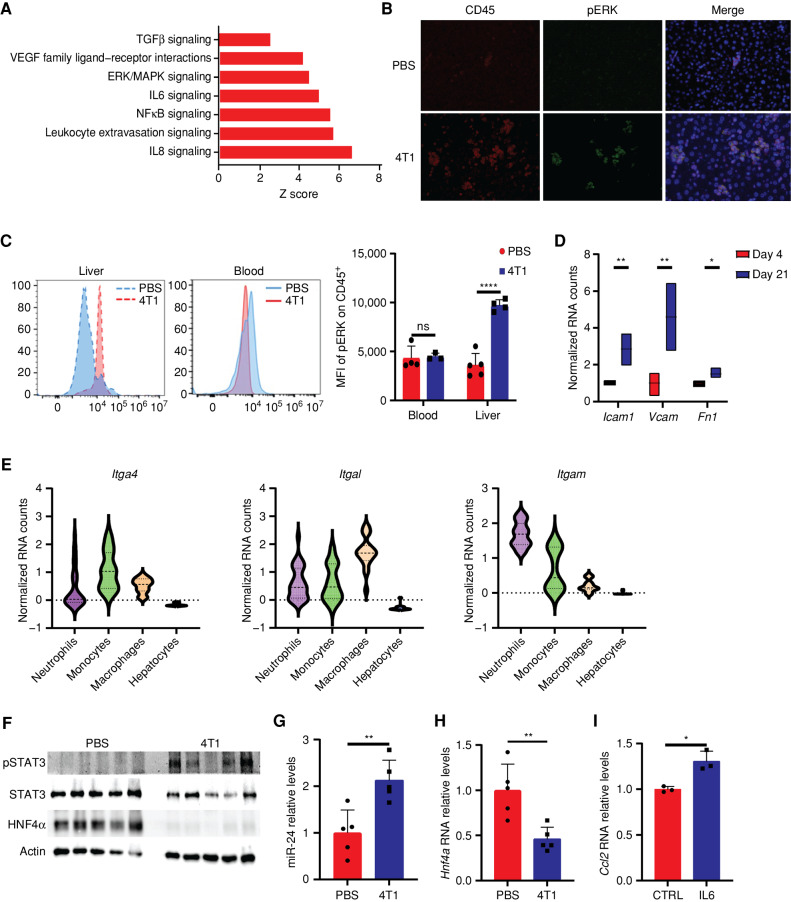
Figure 3. Activated liver-infiltrating myeloid cells perturb liver metabolism via HNF4α depletion. A, Differentially expressed gene pathway enrichment analysis of hepatocytes from breast cancer–bearing mice on day 21 compared with day 4. The bar shows the Z score of a specific pathway. B, Immunofluorescence staining demonstrates increased levels of pERK in CD45+ cells in the livers of breast cancer–bearing mice. C, Mean fluorescence intensity (MFI) of pERK in CD45+ cells demonstrates a specific increase for pERK in the livers of breast cancer–bearing mice compared with WT PBS-injected mice (left) and no significant difference in the staining for CD45+ pERK in the blood (middle; n = 4, Student t test). Quantification is shown on the right. P < 0.0001. ns, not significant. D, Normalized RNA-seq counts for three integrin binders expressed on hepatocytes on days 4 and 21. P < 0.0001, 0.001, 0.027 (respectively). E, Normalized RNA expression counts of integrins (left: Itga4, middle: Itgal, right: Itgam) in neutrophils, monocytes, macrophages, and hepatocytes. F, Western blots demonstrating increased protein expression levels of pSTAT3 and decreased expression of HNF4α in livers of breast cancer–bearing mice compared with livers from WT PBS-injected mice (n = 5, Student t test). G, RT-PCR of livers from breast cancer–bearing mice demonstrates an increase in miR-24 levels (n = 5, Student t test); P = 0.005. H, RT-PCR of livers from breast cancer–bearing mice demonstrates a significant decrease in Hnf4a levels (n = 5, Student t test); P = 0.005. I, RT-PCR of primary hepatocytes demonstrates increased RNA expression of Ccl2 following supplementation of IL6 (n = 3, Student t test, representative experiment of two independent biological replicates); P = 0.009.

Activated liver-infiltrating myeloid cells perturb liver metabolism via HNF4α depletion. A, Differentially expressed gene pathway enrichment analysis of hepatocytes from breast cancer–bearing mice on day 21 compared with day 4. The bar shows the Z score of a specific pathway. B, Immunofluorescence staining demonstrates increased levels of pERK in CD45+ cells in the livers of breast cancer–bearing mice. C, Mean fluorescence intensity (MFI) of pERK in CD45+ cells demonstrates a specific increase for pERK in the livers of breast cancer–bearing mice compared with WT PBS-injected mice (left) and no significant difference in the staining for CD45+ pERK in the blood (middle; n = 4, Student t test). Quantification is shown on the right. P < 0.0001. ns, not significant. D, Normalized RNA-seq counts for three integrin binders expressed on hepatocytes on days 4 and 21. P < 0.0001, 0.001, 0.027 (respectively). E, Normalized RNA expression counts of integrins (left: Itga4, middle: Itgal, right: Itgam) in neutrophils, monocytes, macrophages, and hepatocytes. F, Western blots demonstrating increased protein expression levels of pSTAT3 and decreased expression of HNF4α in livers of breast cancer–bearing mice compared with livers from WT PBS-injected mice (n = 5, Student t test). G, RT-PCR of livers from breast cancer–bearing mice demonstrates an increase in miR-24 levels (n = 5, Student t test); P = 0.005. H, RT-PCR of livers from breast cancer–bearing mice demonstrates a significant decrease in Hnf4a levels (n = 5, Student t test); P = 0.005. I, RT-PCR of primary hepatocytes demonstrates increased RNA expression of Ccl2 following supplementation of IL6 (n = 3, Student t test, representative experiment of two independent biological replicates); P = 0.009.