. 2023 May 4;13(7):1696–1719. doi: 10.1158/2159-8290.CD-22-1315

Figure 2.

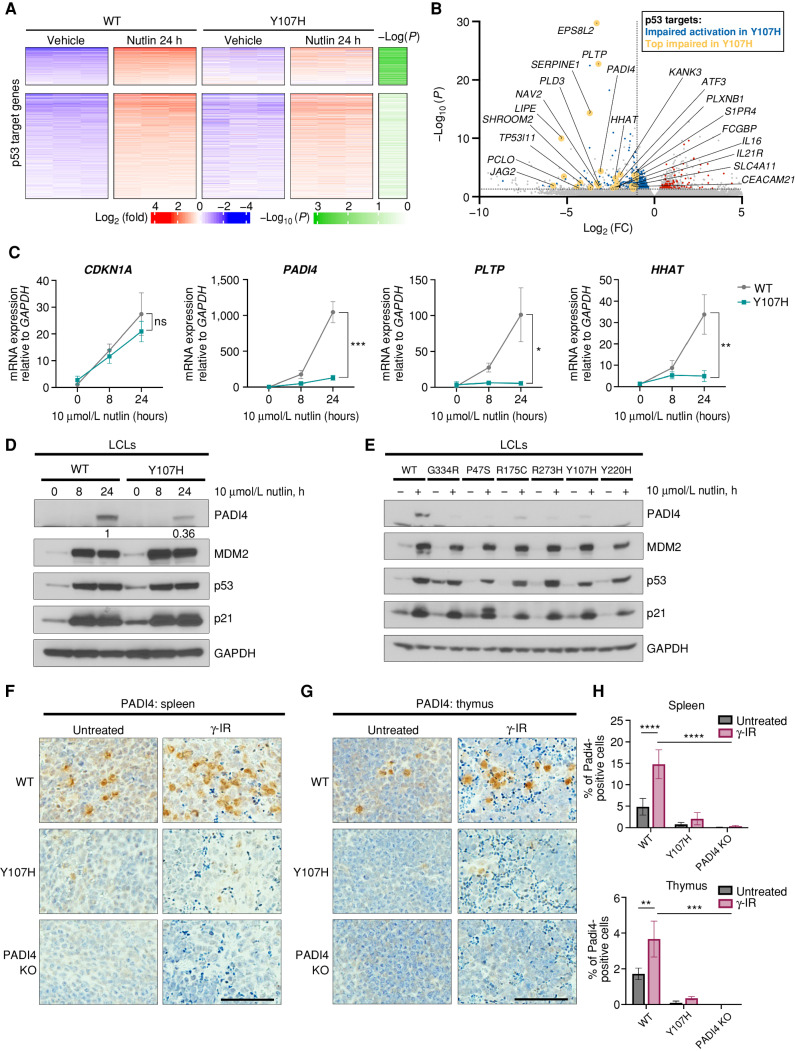
Figure 2. The Y107H variant is impaired for transactivation of a subset of p53 target genes, including PADI4, PLTP, and HHAT. A, Heat map of significantly upregulated p53 target genes from WT and Y107H LCLs in response to 10 μmol/L nutlin at 24 hours. Top, genes that are less responsive in Y107H. Columns, independent biological replicates (n = 3). B, Volcano plot of top differentially regulated genes between WT and Y107H LCLs treated with 10 μmol/L nutlin at 24 hours. Genes within the p53 pathway with significantly less response (blue) or more response (red) of at least 2-fold in Y107H vs. WT cells after nutlin treatment are highlighted. Selected p53 targets are highlighted and labeled (yellow). C, Quantitative PCR analysis of mean expression ± SD of CDKN1A (p21), PADI4, PLTP, and HHAT expression levels in WT and Y107H LCLs after 0, 8, and 24 hours of 10 μmol/L nutlin (n = 3 biological replicates). Expression is normalized to GAPDH. D, Western blot of PADI4 and the p53 target proteins indicated in WT and Y107H cells after 0, 8, and 24 hours of 10 μmol/L nutlin. Densitometry values are included for PADI4 protein levels at 24 hours of nutlin treatment, normalized to GAPDH. Analyses are representative of multiple independent replicates. E, Western blot of PADI4 and the p53 target proteins indicated in LCLs with WT p53 and multiple hypomorphic variants of p53. All lines are heterozygous for the hypomorph—that is, hypomorph/WT. R273H is a p53 hotspot mutant. Results are representative of at least 3 independent replicates. F and G, IHC from Hupki WT, Y107H, and PADI4 knockout (KO) mice irradiated with 5 Gy and analyzed after 4 hours (n = 3 mice per condition) and stained for PADI4 expression in the spleen (F) and thymus (G). Scale bar, 50 μm. H, Quantification of percent positive cells from IHC of WT, Y107H, and PADI4 KO mice in (F and G). γ-IR, gamma radiation. Averages ± SEM from at least three random images from n = 3 mice per condition. *, P < 0.05; **, P < 0.01; ***, P < 0.001; ****, P < 0.0001; ns, not significant, two-tailed unpaired t test.

The Y107H variant is impaired for transactivation of a subset of p53 target genes, including PADI4, PLTP, and HHAT. A, Heat map of significantly upregulated p53 target genes from WT and Y107H LCLs in response to 10 μmol/L nutlin at 24 hours. Top, genes that are less responsive in Y107H. Columns, independent biological replicates (n = 3). B, Volcano plot of top differentially regulated genes between WT and Y107H LCLs treated with 10 μmol/L nutlin at 24 hours. Genes within the p53 pathway with significantly less response (blue) or more response (red) of at least 2-fold in Y107H vs. WT cells after nutlin treatment are highlighted. Selected p53 targets are highlighted and labeled (yellow). C, Quantitative PCR analysis of mean expression ± SD of CDKN1A (p21), PADI4, PLTP, and HHAT expression levels in WT and Y107H LCLs after 0, 8, and 24 hours of 10 μmol/L nutlin (n = 3 biological replicates). Expression is normalized to GAPDH. D, Western blot of PADI4 and the p53 target proteins indicated in WT and Y107H cells after 0, 8, and 24 hours of 10 μmol/L nutlin. Densitometry values are included for PADI4 protein levels at 24 hours of nutlin treatment, normalized to GAPDH. Analyses are representative of multiple independent replicates. E, Western blot of PADI4 and the p53 target proteins indicated in LCLs with WT p53 and multiple hypomorphic variants of p53. All lines are heterozygous for the hypomorph—that is, hypomorph/WT. R273H is a p53 hotspot mutant. Results are representative of at least 3 independent replicates. F and G, IHC from Hupki WT, Y107H, and PADI4 knockout (KO) mice irradiated with 5 Gy and analyzed after 4 hours (n = 3 mice per condition) and stained for PADI4 expression in the spleen (F) and thymus (G). Scale bar, 50 μm. H, Quantification of percent positive cells from IHC of WT, Y107H, and PADI4 KO mice in (F and G). γ-IR, gamma radiation. Averages ± SEM from at least three random images from n = 3 mice per condition. *, P < 0.05; **, P < 0.01; ***, P < 0.001; ****, P < 0.0001; ns, not significant, two-tailed unpaired t test.