. 2023 May 4;13(7):1696–1719. doi: 10.1158/2159-8290.CD-22-1315

Figure 4.

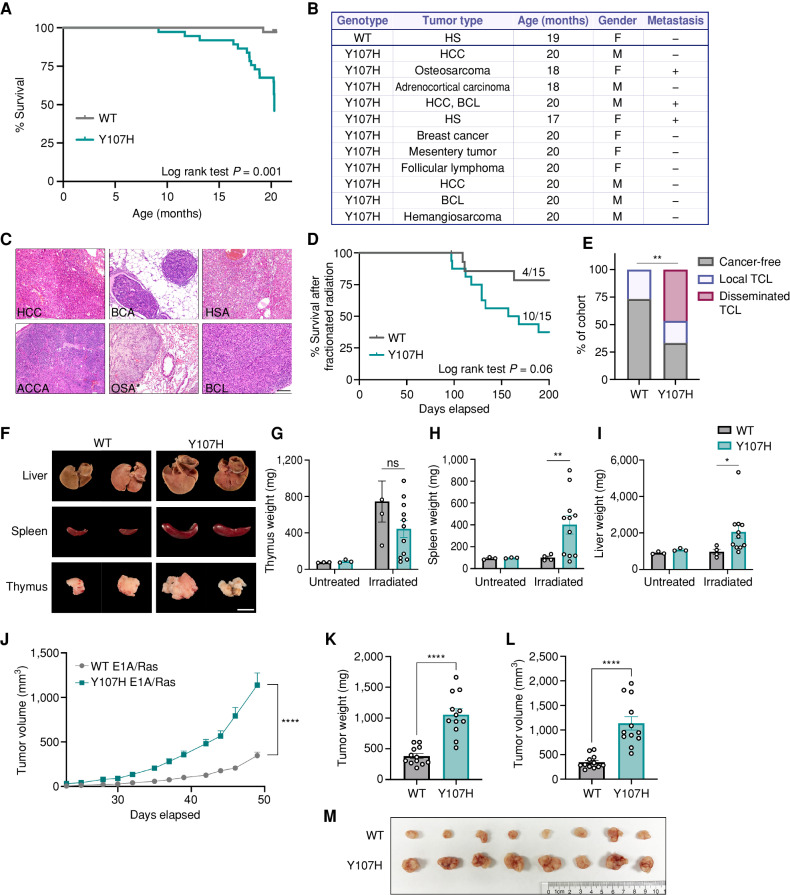
Figure 4. Y107H mice show significantly increased cancer risk. A, Kaplan–Meier analysis of survival between Hupki WT p53 (n = 36) and Y107H mice (n = 35). P = 0.001 using a log-rank test. B, Summary of cancer incidence in Hupki WT and Y107H mice. Data are representative of 36 WT and 35 Y107H mice. BCL, B-cell lymphoma; HCC, hepatocellular carcinoma; HS, histiocytic sarcoma. C, Hematoxylin and eosin staining of tumors from the Y107H mouse. Top left, HCC in the liver. Top middle, breast carcinoma (BCA). Top right, hemangiosarcoma (HSA) within the liver. Bottom left, adrenocortical carcinoma (ACCA). Bottom middle, osteosarcoma (OSA) metastasized to the lung. (The * indicates it is not the primary tumor site but a metastatic lesion in the lung.) Bottom right, BCL in an enlarged lymph node. Scale bar, 100 μm. D, Kaplan–Meier analysis of survival between WT (n = 15) and Y107H (n = 15) mice after fractionated radiation. P = 0.06 using the log-rank test. E, Proportion of WT and Y107H mice that underwent fractionated radiation with thymic tumors. Analyzed proportion of mice with disseminated lymphoma using Fisher exact test; **, P = 0.008. TCL, T-cell lymphoma. F, Representative images of liver, spleen, and thymus sizes at the time of harvest in Y107H mice compared with WT following fractionated radiotherapy. Scale bar, 80 mm. G–I, Mean weights ± SEM of thymus (G), spleen (H), and liver (I) tissue from healthy age-matched mice or mice that underwent fractionated radiotherapy. J, Tumor growth of E1A/Ras-transformed MEFs with WT p53 (n = 12) or the Y107H variant (n = 12) subcutaneously injected into NOD scid gamma mice. K–M, Tumor weights (K), tumor volumes (L), and representative tumor sizes (M) from WT and Y107H E1A/Ras xenografts, shown as mean weights ± SEM. *, P < 0.05; **, P < 0.01; ****, P < 0.0001; ns, not significant, two-tailed paired t test with Welch correction.

Y107H mice show significantly increased cancer risk. A, Kaplan–Meier analysis of survival between Hupki WT p53 (n = 36) and Y107H mice (n = 35). P = 0.001 using a log-rank test. B, Summary of cancer incidence in Hupki WT and Y107H mice. Data are representative of 36 WT and 35 Y107H mice. BCL, B-cell lymphoma; HCC, hepatocellular carcinoma; HS, histiocytic sarcoma. C, Hematoxylin and eosin staining of tumors from the Y107H mouse. Top left, HCC in the liver. Top middle, breast carcinoma (BCA). Top right, hemangiosarcoma (HSA) within the liver. Bottom left, adrenocortical carcinoma (ACCA). Bottom middle, osteosarcoma (OSA) metastasized to the lung. (The * indicates it is not the primary tumor site but a metastatic lesion in the lung.) Bottom right, BCL in an enlarged lymph node. Scale bar, 100 μm. D, Kaplan–Meier analysis of survival between WT (n = 15) and Y107H (n = 15) mice after fractionated radiation. P = 0.06 using the log-rank test. E, Proportion of WT and Y107H mice that underwent fractionated radiation with thymic tumors. Analyzed proportion of mice with disseminated lymphoma using Fisher exact test; **, P = 0.008. TCL, T-cell lymphoma. F, Representative images of liver, spleen, and thymus sizes at the time of harvest in Y107H mice compared with WT following fractionated radiotherapy. Scale bar, 80 mm. G–I, Mean weights ± SEM of thymus (G), spleen (H), and liver (I) tissue from healthy age-matched mice or mice that underwent fractionated radiotherapy. J, Tumor growth of E1A/Ras-transformed MEFs with WT p53 (n = 12) or the Y107H variant (n = 12) subcutaneously injected into NOD scid gamma mice. K–M, Tumor weights (K), tumor volumes (L), and representative tumor sizes (M) from WT and Y107H E1A/Ras xenografts, shown as mean weights ± SEM. *, P < 0.05; **, P < 0.01; ****, P < 0.0001; ns, not significant, two-tailed paired t test with Welch correction.