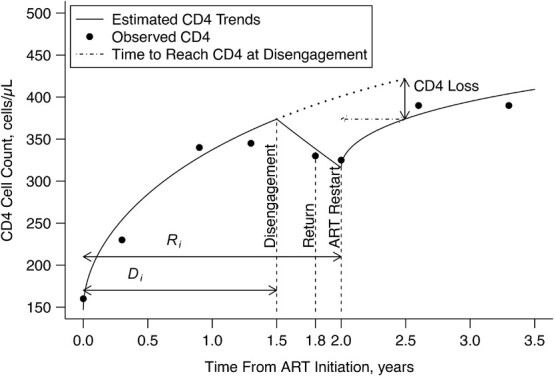
Figure 1.

Estimated CD4 cell-count trajectory (based on a linear mixed model including subject-specific knots at time from antiretroviral therapy (ART) initiation to disengagement from care  and resumption of treatment
  , fitted to data from the IeDEA Collaboration) among individuals who disengaged from and subsequently reengaged in care, East Africa, 2001–2011. Shown is the estimated evolution of CD4 cell count (back-transformed from the square-root scale) assuming that the time from ART initiation to disengagement is
  years and the time gap from disengagement from care to ART reinitiation is
  months, along with the observed CD4 cell counts (black dots). Also shown is the amount of time it takes to reach the predisengagement CD4 levels and the difference between the CD4 levels 6 months after treatment reinitiation and the CD4 levels that would have been observed had disengagement not happened by that time. AIDS, acquired immunodeficiency syndrome; IeDEA, East Africa International Epidemiology Databases to Evaluate AIDS.
