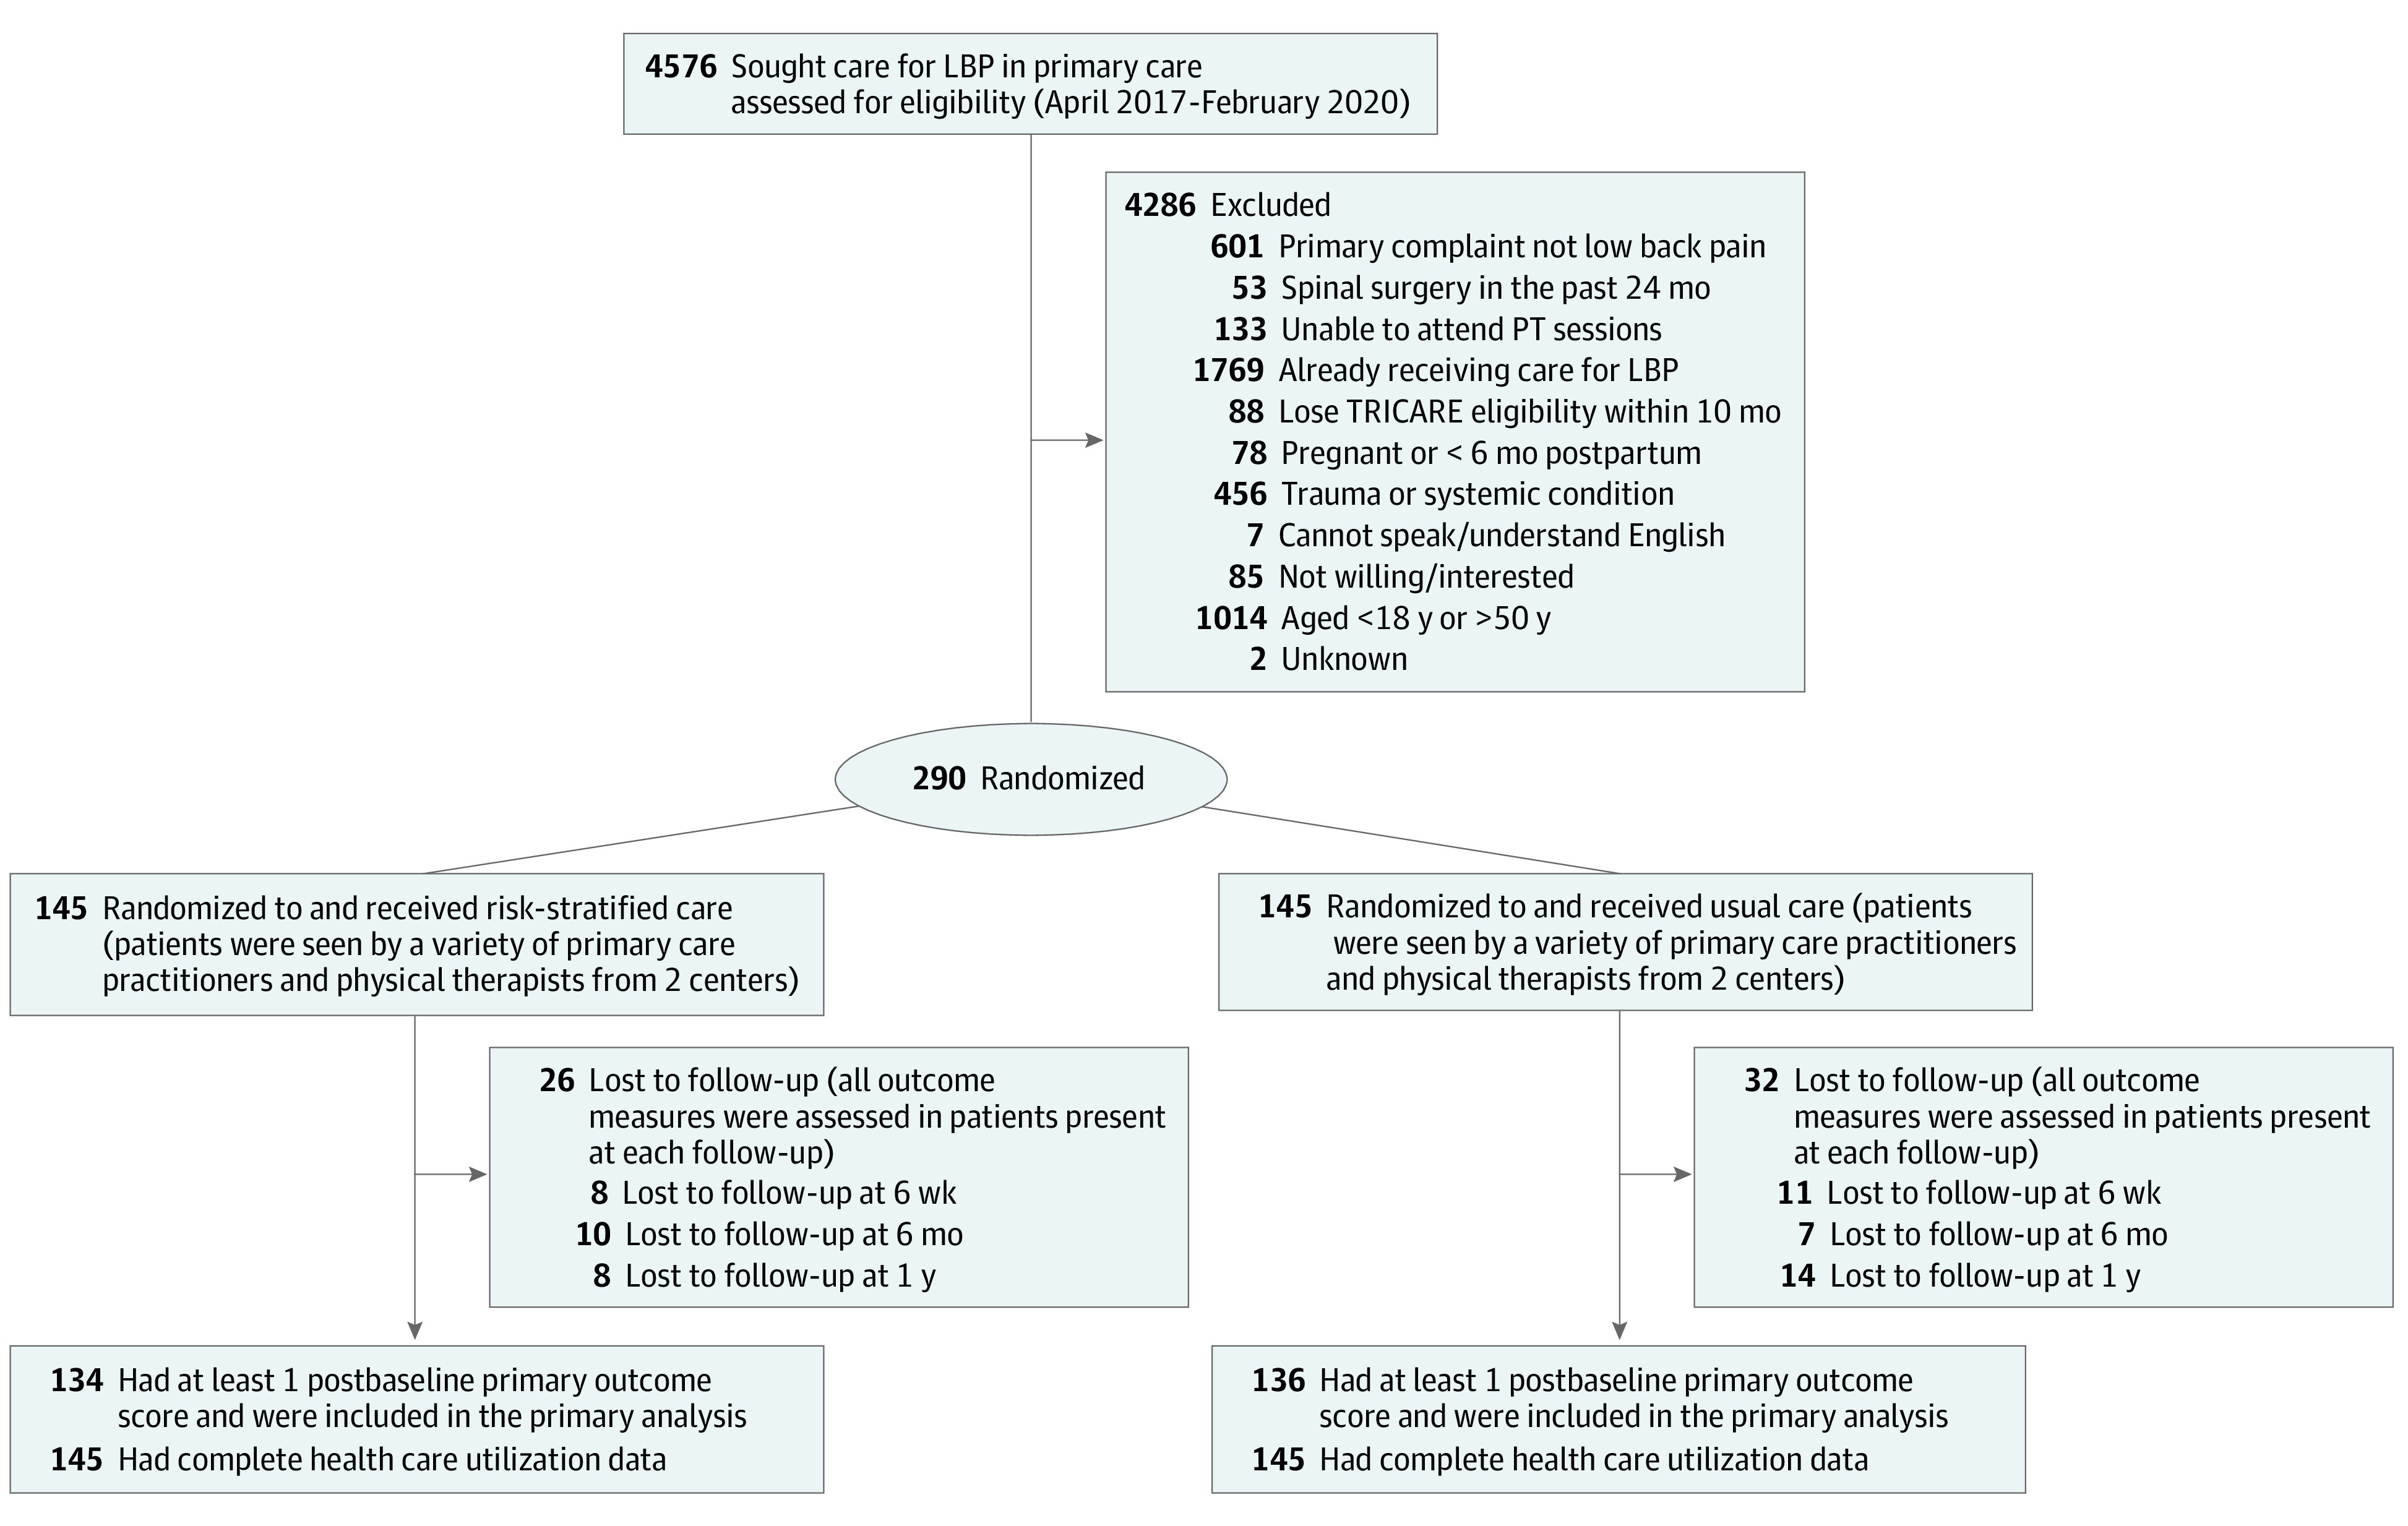
Figure. Study Flow Diagram.

Lost to follow-up values represent the total number of participants lost to follow-up at each time point in each group and are not summative values. Some participants may have missed an early follow-up but still kept a later one. LBP indicates lower back pain; PT, physiotherapy.
