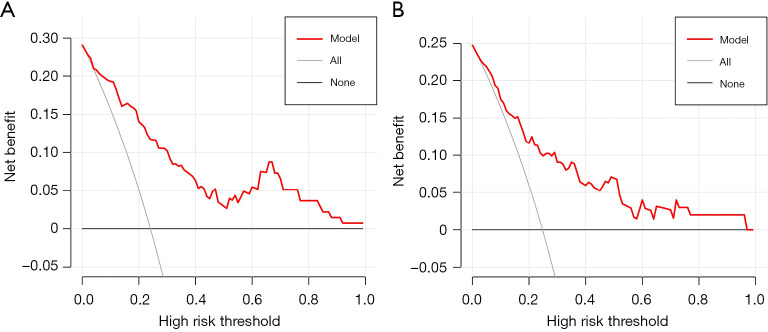
Figure 4.
Decision curve analysis for the nomogram to predict LCOS after surgical repair of tetralogy of Fallot in the training dataset (A) and validation dataset (B). The y-axis represents the net benefits. The red line represents the nomogram. The grey line represents the assumption that all patients have LCOS. The black line represents the assumption that no patients have LCOS. The decision curve showed that using the nomogram to predict postoperative LCOS adds more benefits than the treat-all-patient scheme or the treat-none scheme both in the training dataset (A) and validation dataset (B). LCOS, low cardiac output syndrome.

