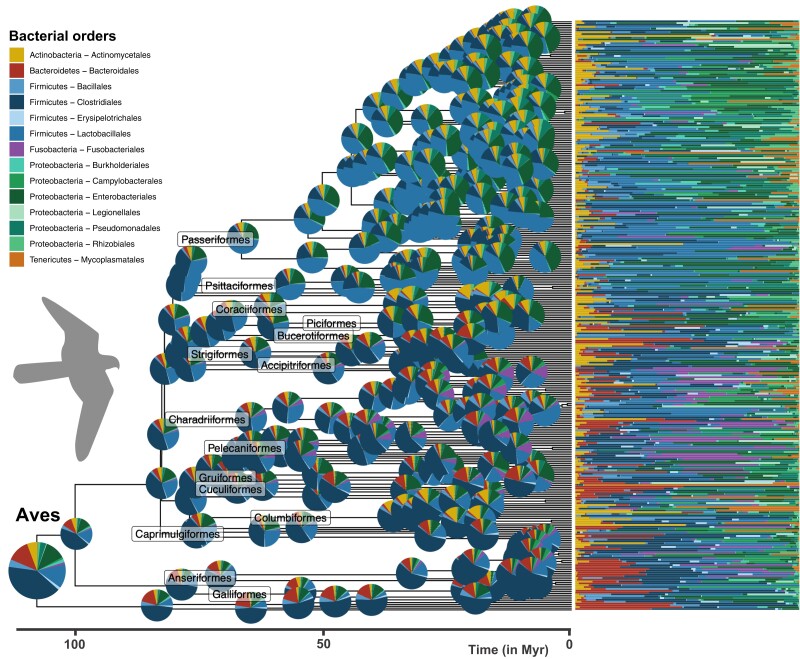
Fig. 4.
Ancestral reconstruction of avian gut microbiota. Phylogenetic tree of the sampled birds and associated relative abundances of the 14 most abundant bacterial orders (bar charts on the right). Pie charts at the root and nodes of the tree represent estimated ancestral microbiota compositions (mean of the posterior distribution of at the root and generalized least squares estimates at other internal nodes). Compositions are not represented at the most recent nodes for the sake of clarity.

