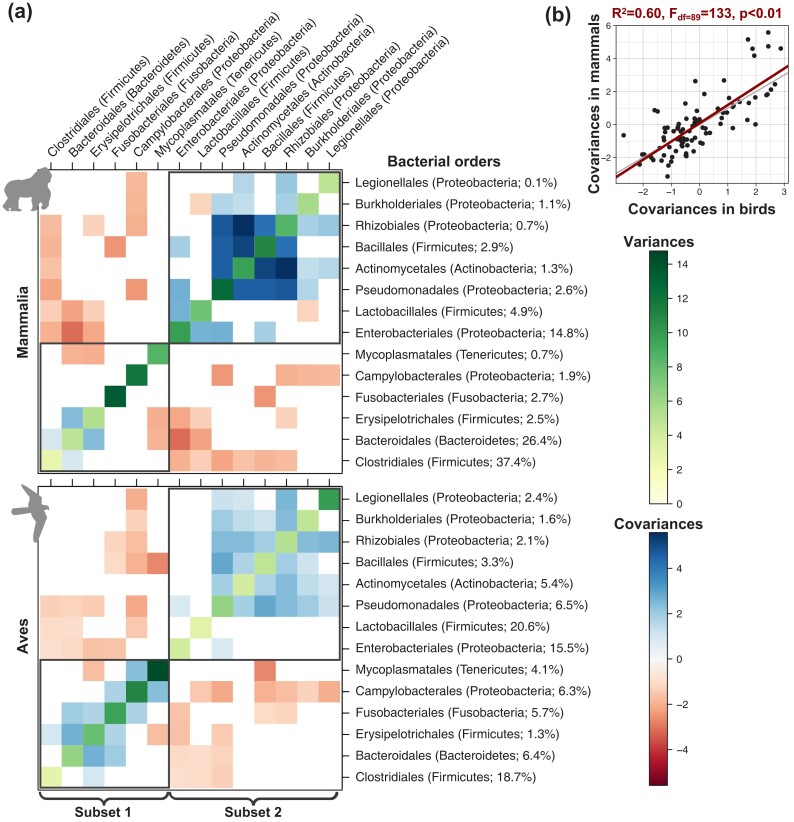
Fig. 6.
Estimated variances and covariances between the main bacterial taxa tend to be similar in the gut microbiota of mammals and birds. (A) For each variance–covariance matrix between bacterial taxa estimated using our model of host microbiota evolution, we represented negative covariances in red and positive covariances in blue, whereas variances are represented in shades of green. Nonsignificant covariances are represented in white. Grey rectangles correspond to subsets of bacterial orders that tend to covary positively. (B) Correlation between covariances between the main bacterial taxa estimated in the gut microbiota of mammals or birds. The red line indicates the corresponding linear model, whereas the grey line corresponds to y = x.

