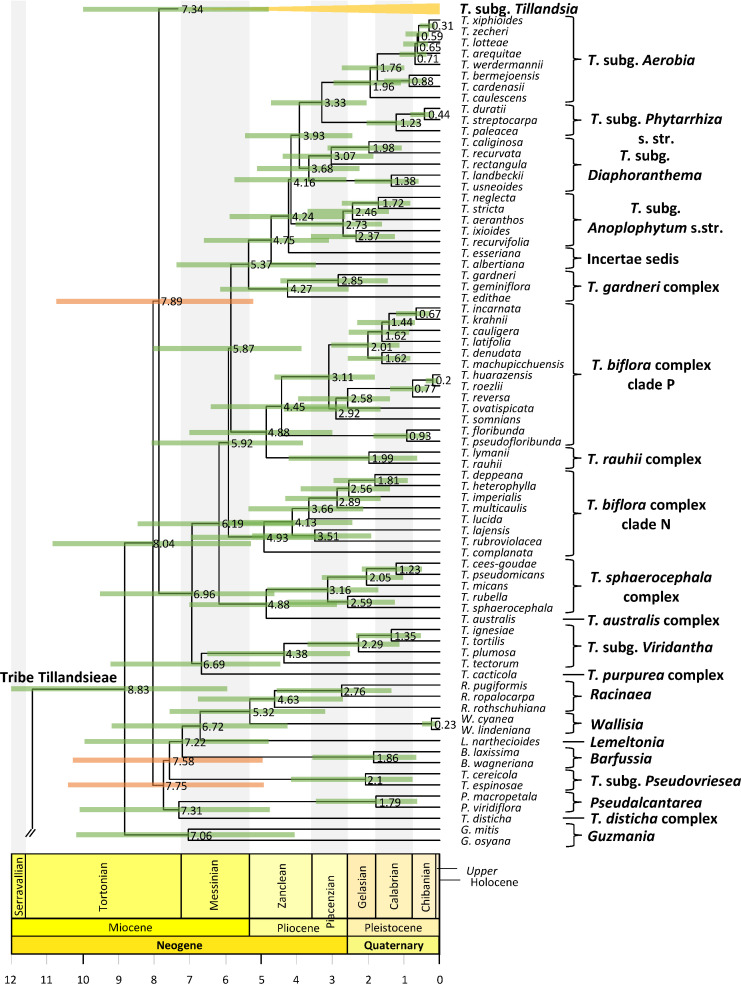
Figure 3.
Tribe Tillandsieae phylogenetic relationships. Maximum clade credibility tree derived from the analysis of full plastomes. Bars associated with age values are the 95% highest posterior density (HPD) intervals. Green and orange HPD bars denote highly supported (PP ≥0.85) and non-highly supported (PP ≤0.85) nodes, respectively. Clade names follow Barfuss et al. (2016).

