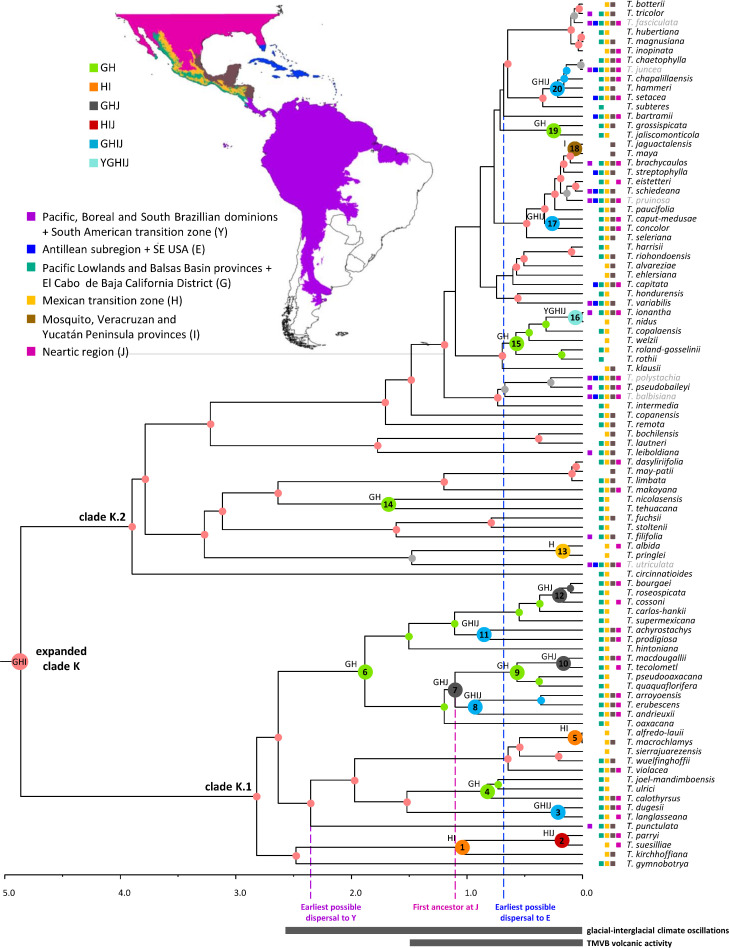
Figure 7.
Dispersal history of the focal group expanded clade K. Colored circles denote the most probable individual or combined ancestral area under the BAYAREALIKE+J model for highly supported (PP ≥ 0.85) internal nodes. Larger circles at internal nodes denote area shifts. Node numbers correspond to those discussed in the text. Current geographic distribution of the species is denoted by colored squares. Excluded cosmopolitan species and their associated nodes are shown in gray. Proposed periods of main tectonic events discussed in the text are denoted by gray bars below time scale. Clade names follow Granados Mendoza et al. (2017). Source of Map: http://tapiquen-sig.jimdo.com (Carlos Efraín Porto Tapiquén. Orogénesis Soluciones Geográficas. Porlamar, Venezuela 2015. Based on layers from the Enviromental Systems Research Institute - ESRI).

