Figure 1.

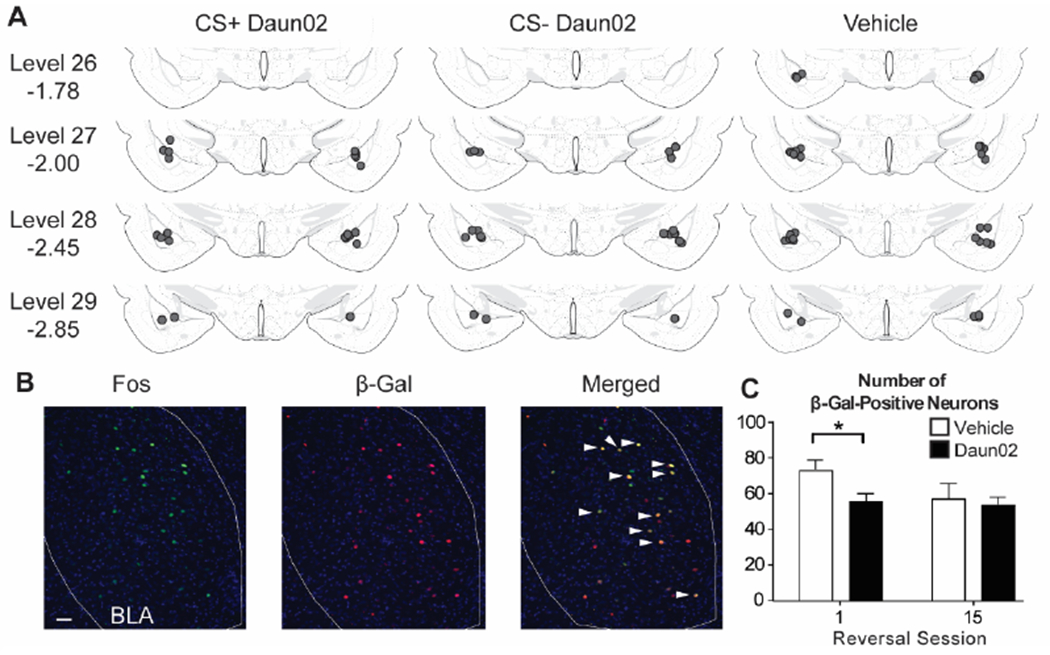
Cannula placements and Fos and β-Gal induction. (A) All cannula placements were within levels 26-29 of the BLA (−1.78 to −2.85mm from Bregma as indicated) and similar across drug groups. (B) Representative images showing Fos, β-Gal, and colocalization (white arrows). (C) There was a significant reduction in β-Gal-labeled neurons in the group that received Daun02 and were perfused after the first reversal session, but not the last reversal session. Scale bar = 25 μm. * p < 0.05.
