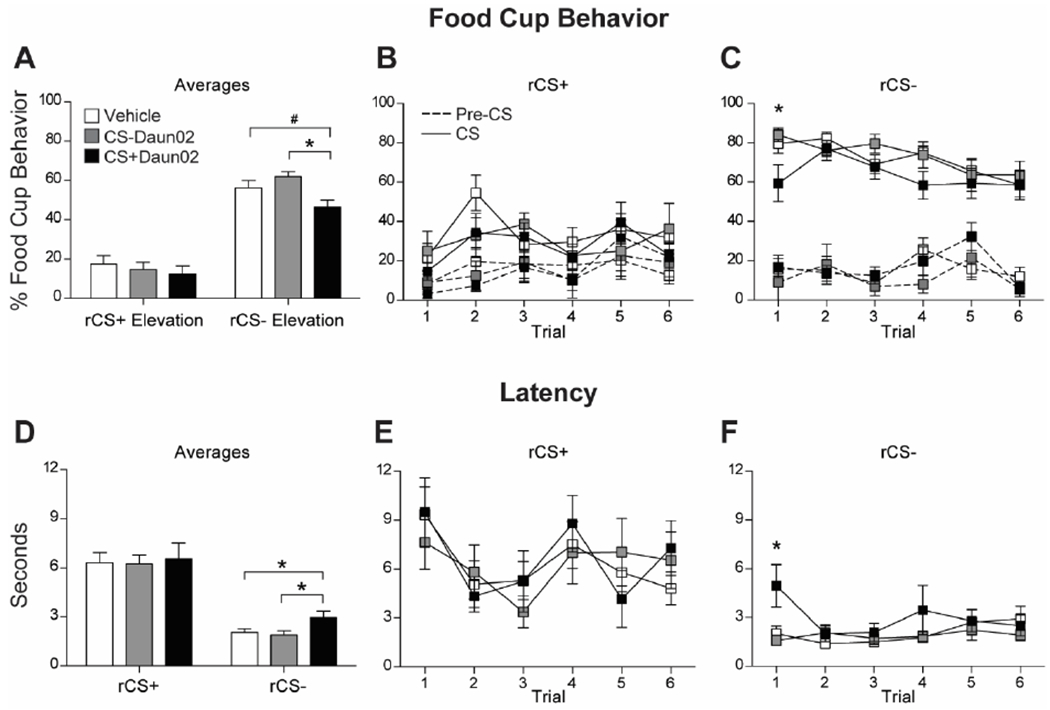
Figure 2.

Conditioned responding during Reversal Session 1. (A) Average food cup responding (mean ± SEM) during rCS+ and rCS− during Reversal Session 1. Data shown as Elevation score (CS responding minus pre-CS [baseline] responding). (B,C) Food cup responding to each rCS+ trial (B) and rCS− trial (C) during the session. Solid line represents responding during the CS, and dashed line represents responding during the pre-CS (baseline) period. (D) Average latency to approach the food cup (mean ± SEM) during the rCS+ and rCS− during the session. (E,F) Latency responding to each rCS+ trial (E) and rCS− trial (F) during the session. # p = 0.05; * p < 0.05.
