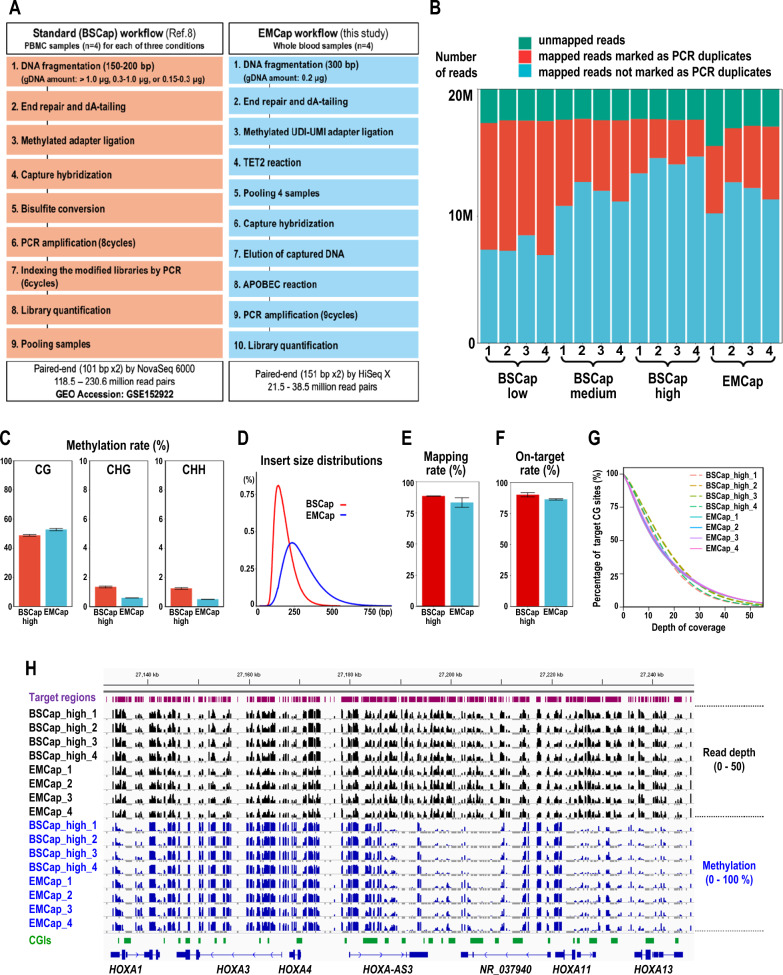
Fig. 1.
Comparisons of experimental procedures and sequencing metrics between the Agilent’s SureSelect XT Human Methyl-Seq (BSCap) and EMCap. A Comparison of experimental procedures. B Comparison of PCR duplication rates between the BSCap data (GSE152922) and the EMCap data. “High”, “Mid”, and “Low” correspond to the amounts of genomic DNA used for BSCap library preparation, i.e., > 1000 ng, 300–1000 ng, and 150–300 ng, respectively. C–H. Comparison between BSCap_high and EMCap libraries. C Mean methylation rates of cytosines in CpG, CHG, and CHH nucleotides. D Insert size distributions. E Mapping rates. F On-target rates. G Cumulative plots of the read depth for the 3,147,687 target CpG sites covered in one or more libraries (read depth > = 1) for each of four EMCap and four BSCap_high libraries. H Read depths and methylation values of individual target CpG sites with the minimum coverage of 10 or greater among eight libraries visualized for a 120 kb interval (hg19) from the HOXA gene cluster region on chromosome 7 using Integrative Genomics Viewer (IGV; https://igv.org/). An igv format file for data visualization was generated as described previously [11]. Genomic intervals of the capture targets are shown in the “Target regions” track by visualizing the bait information (S03770311_Covered.bed) for the SureSelect XT Human Methyl-Seq Capture Library (Agilent). The “CGIs” track shows the positions of the CpG islands retrieved from the UCSC Genome Browser (https://genome.ucsc.edu/). Only a subset of genes within the interval is shown for simplicity. Negative values were assigned (− 10 for read depth and − 1 for methylation) when the read depth for a target CpG site is zero, and are shown in gray bars to help distinguishing “missing value” from “0% methylation”. The data ranges of non-negative values are 0 to 50 for read depth and 0 to 1 (0 to 100%) for DNA methylation

