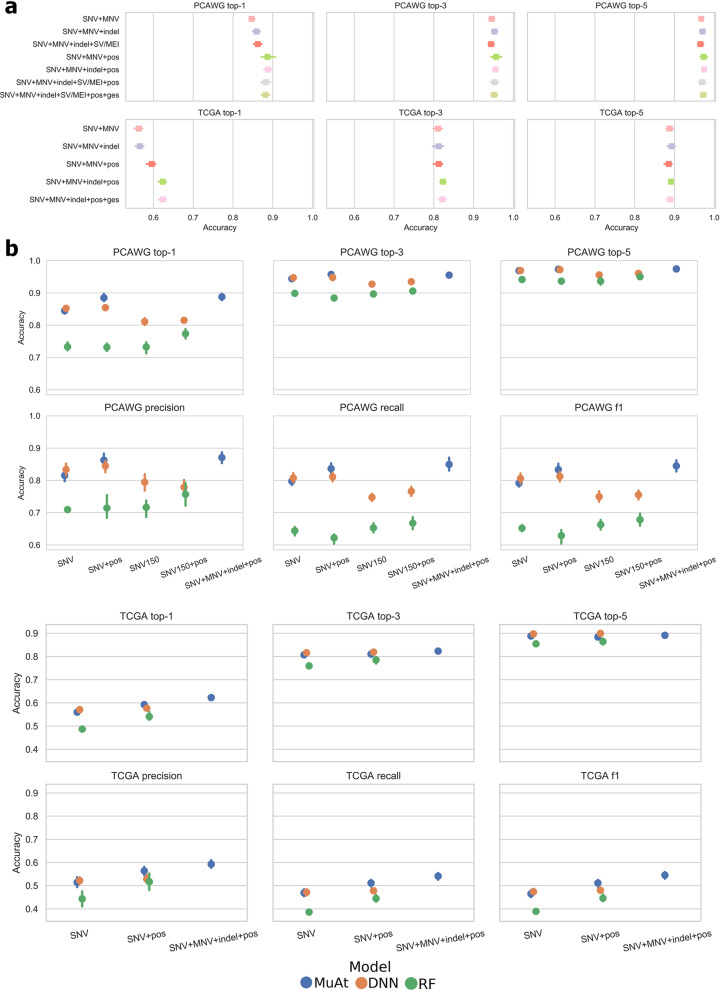
Fig. 2.
Benchmarking MuAt prediction performance. a Top-1, top-3 and top-5 accuracies of MuAt models trained with different mutation types and annotations in PCAWG cancer genomes (top) and TCGA cancer exomes (bottom). Cross-validation accuracies are shown, with the standard deviation of accuracy in cross-validation folds indicated by error bars. b Prediction performance of MuAt in PCAWG genomes and TCGA exomes against a recent DNN model [20] and a random forest model (RF). SNV150 indicates the feature set used in [20], “ges” stands for genic, exonic and strand attributes

