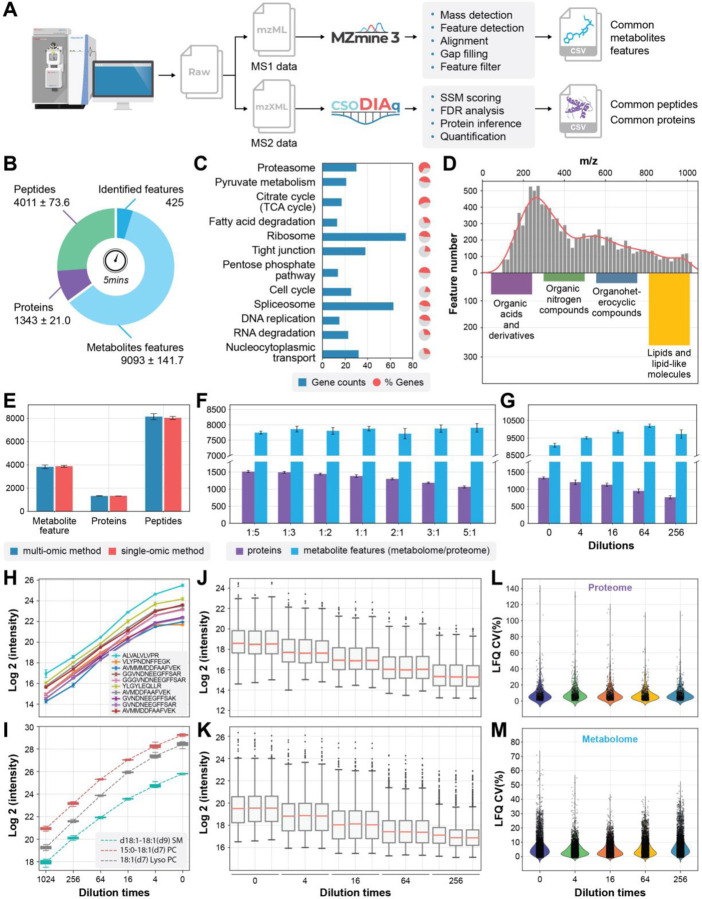
Fig. 2|. Data processing, performance optimization and quantitative evaluation of SMAD.
a, Scheme showing data processing flow started from a typical raw file produced by SMAD. b, Number of detected metabolite features, peptides, and proteins in 5 minutes acquisition time by SMAD of 293T cells. c, KEGG pathway enrichment analysis of the proteins identified by SMAD of 293T cells. The bars indicate how many proteins in the pathway were identified, and the colored proportion of the circle reflects the coverage of the proteins in each pathway. d, m/z distribution of detected metabolite features and classes of identified metabolite features by SMAD of 293T cells. e, The comparison of detected molecule features (metabolites, peptides, proteins) between simultaneously multi-omics acquisition method and separately single-omic acquisition method. f, The effect of different mixing proportions of peptides and metabolites on detected molecule features by SMAD. (metabolome/proteome) g, Performance of SMAD in detecting of different concentrations. Original concentration is proteome samples dissolved in 40ul metabolome extraction (produced by adding 500ul solvent to 2million cells) and maintain the final proteome concentration to 4ug/Ul. h,i, label free quantification curve of standard peptides from MS-QCAL protein (h) and standard lipids from Avanta (i) at different concentrations. j,k, Untargeted quantification of detected proteins and metabolite features was performed by SMAD (each ratio was measured in triplicate). l,m, coefficient of variation of all quantified proteins and metabolite features.

