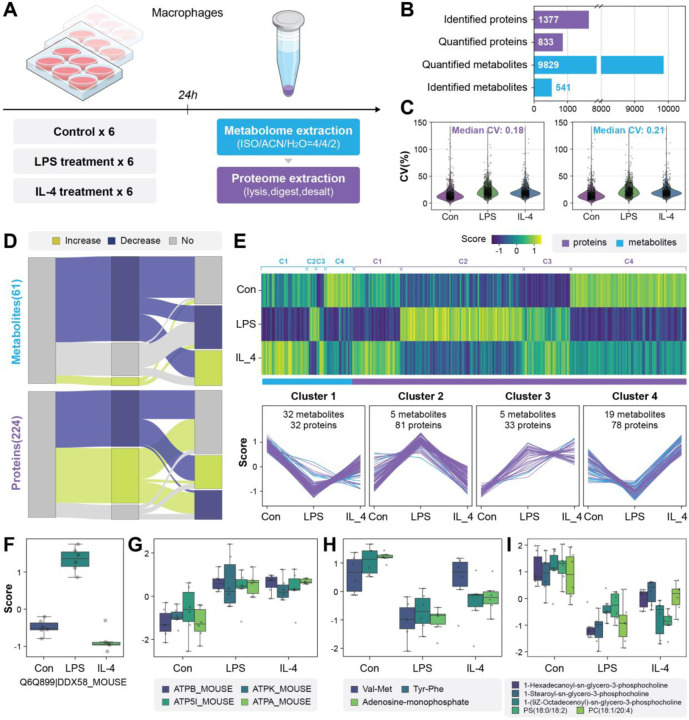
Fig. 3|. Application of SMAD for rapid multi-omics screening of macrophage polarization.
a, Schematic diagram of experimental design. (LPS: lipopolysaccharide, IL-4: Interleukin 4). b, Overview of molecules monitored by SMAD. c, Changes of significant and identified molecules (metabolites and proteins) between two treatments and control. (two-sided Wilcoxon rank test). d, The Heatmap and clustering of dysregulated molecules following immune activation. (K-means clustering). e,f Typical dysregulated proteins of macrophages after immune stimulator treatment. g,h Typical dysregulated metabolites and lipids after LPS treatment.

