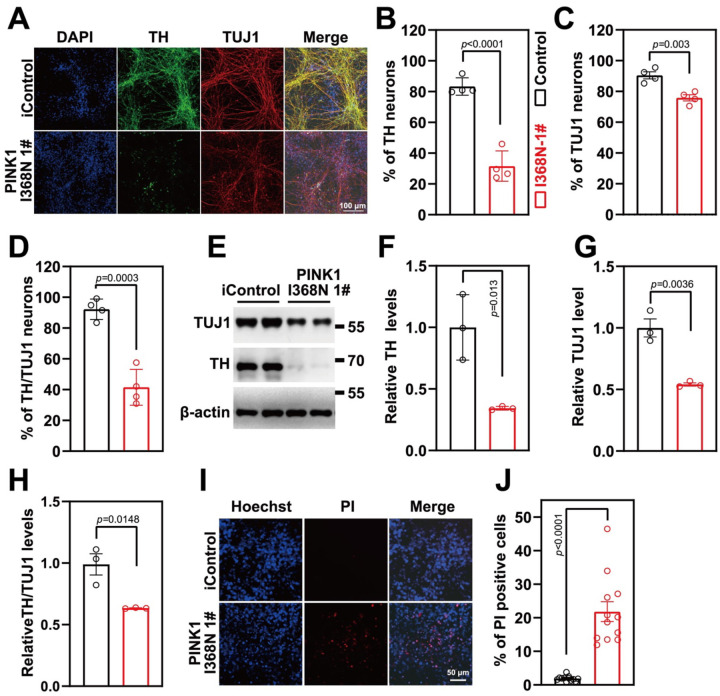
Figure 1. DA neuron differentiation and characterization.
A. Representative images of differentiated DA neuron at day 60 from isogenic control and PINK1 p.I368N 1# mutant lines for neurons (TUJ1, Red) and dopaminergic neurons (TH, green), DAPI staining in blue represents the nucleus.
B. Quantification of TH positive neuron percentage of immunostaining.
C. Quantification of TUJ1 positive neuron percentage of immunostaining.
D. Quantification of TH/TUJ1 double positive neuron percentage of immunostaining.
E. Immunoblot analysis of TH and TUJ1 protein level in differentiated DA neurons.
F. Quantified intensities of TH are shown, relative protein level was normalized to β-actin. N=3 independent experiments.
G. Quantified intensities of TUJ1 are shown, relative protein level was normalized to β-actin. N=3 independent experiments.
H. Quantified intensities of TH/TUJ1 are shown.
I. Representative images of PI staining, DAPI is in blue, PI is in red.
J. Quantification of PI staining. N=3 independent experiments.

